Last week a government agency put out a news release that attracted a lot of attention. It began:
The Consumer Price Index for All Urban Consumers (CPI-U) was unchanged in July on a seasonally adjusted basis after rising 1.3 percent in June, the U.S. Bureau of Labor Statistics reported today. Over the last 12 months, the all items index increased 8.5 percent before seasonal adjustment.
The BLS always reports the monthly change first in these inflation reports (or at least it has since 1994, which is how far back its news release archive goes), but it’s the 12-month change that tends to get cited most in the media and in political discourse. So when President Joe Biden and others in his administration chose to emphasize what Biden called “July’s 0% inflation,” he got a lot of blowback on that narrow but in this case informative slice of the national discourse that is Twitter.
Much of it came from right-leaning politicians and political commentators, as well as Twitter Inc. fact checkers, who don’t understand how inflation is calculated, which in turn inspired much tut-tutting from economic commentators who do. The price level, as measured by the CPI, did not increase from June to July — more precisely, it declined 0.019%, which the BLS rounded to zero. Biden’s statement was not false.
It was of course incomplete, but elected officials have been emphasizing the economic statistics that make them look good and downplaying the ones that make them look bad since the advent of economic statistics. Perhaps it was politically unwise of Biden to do so in this case, but that’s not really my department. What I am curious about is what the right time period is over which to measure inflation.
Most monthly economic statistics are reported in terms of the change from the previous month, which makes sense given that the monthly change is the new information. Again, this is the statistic mentioned first in BLS inflation reports. But the annual percentage change is a lot easier to get one’s head around than the often-sub-1% monthly changes. And while it’s simple enough to convert monthly changes into annual rates (along the lines of what the U.S. Bureau of Economic Analysis does with quarterly gross domestic product), with inflation the results can be dizzyingly volatile. The annualized rate of monthly inflation was -0.2% in July, 17.1% in June, 12.3% in May and 4.1% in April. That’s maybe not so informative!
But while most of the time the 12-month change is a simpler and more sensible way to gauge the inflationary trend, at turning points or “regime changes” it really isn’t. As inflation rapidly accelerated in early 2021, with annualized monthly increases of 3% in January, 5.4% in February and 7.9% in March, the headline year-over-year figures were 1.4%, 1.7% and 2.7%, respectively. That also wasn’t so informative!
One way to get around this might be to look at changes over periods other than one month and one year. As Harvard economist and former Bill Clinton and Barack Obama adviser Jason Furman put it on Twitter:
Some time periods that you can/should measure and usefully think about inflation over: 1 month 2 months 3 months 4 months 5 months 6 months 7 months 8 months 9 months 10 months 11 months 12 months 13 months 14 months ... 23 months 24 months 25 months 26 months 27 months ...
In that spirit, I calculated current inflation over every period from one to 24 months, with all the rates annualized to make them comparable:
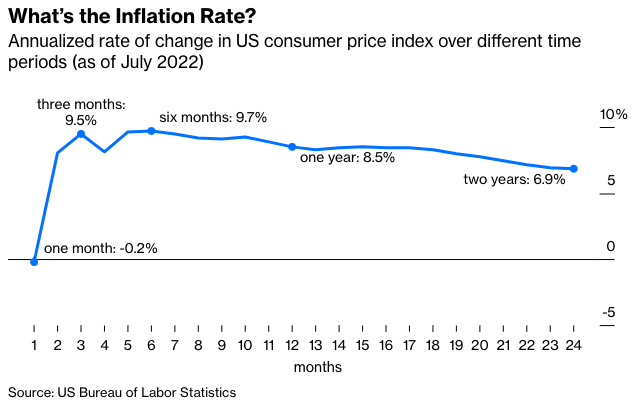
The slightly negative one-month inflation number is the anomaly here. The three-month and six-month inflation rates are (when converted into annual rates) even higher than the one-year rate. Maybe July’s price stability is a harbinger of lower inflation ahead, or maybe it’s just a reflection of the volatility of the price of gasoline, which makes up about 5% of the spending basket reflected in CPI. Gas prices fell at a 62% annual rate in July after rising 256% annualized in June and 62% in May.
To get around that volatility, monetary policy makers and other inflation observers often look at the price level minus food and energy, aka “core” CPI. Here’s core inflation measured over every period from one to 24 months.
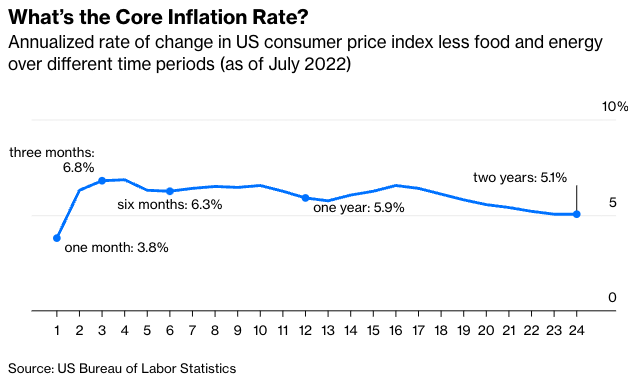
Inflation is markedly lower over one month than over the other periods here, too, which I guess raises the odds that it really is downshifting. Then again, it was still 3.8% in July, and the Federal Reserve Bank of Cleveland’s inflation “nowcast” as of Aug. 15 has it bouncing back to 5.9% annualized in August.
Other ways of getting at the true inflation rate include measures such as the Cleveland Fed’s median and trimmed-mean CPIs, both of which rose in July while the all-items CPI stayed flat, and the personal consumption expenditures price index for July that will be released Aug. 26 by the Bureau of Economic Analysis and usually generates inflation rates a bit lower than the CPI-based ones.
Last week’s Twitter discussions also revealed some interesting personal approaches. “I try to set half my mood based on the current month’s inflation print, a quarter based on the prior month’s, and the remaining quarter based on the previous 10 months,” wrote Marc Goldwein of the Committee for a Responsible Federal Budget. Alan Cole of the Conference Board offered this (tongue-in-cheek, I think) suggestion:
The ideal is the infinite sum of all monthly inflation measurements, each multiplied by (2/3)^n, where n is the number of months ago. All divided by three, of course, to get a weighted average from the infinite series…
I tried that with monthly CPI data going back to 1913. It came to 6% annualized inflation in July. That’s down from 9% in June (yay!). It’s still a lot more than zero.
Justin Fox is a Bloomberg Opinion columnist covering business. A former editorial director of Harvard Business Review, he has written for Time, Fortune and American Banker. He is author of The Myth of the Rational Market