Last week, we discussed whether stock prices might be reflecting peak optimism. In that commentary, we noted that while sentiment may be overly optimistic and a pickup in volatility would be totally normal, strong breadth measures suggest stocks still may have more upside. This week, we tackle that same topic of peak optimism, but by looking at some valuation metrics. While valuations are elevated, they still appear reasonable when factoring in interest rates and inflation.
Valuations Appear Elevated On Traditional Metrics
Based on the most commonly used valuation metrics such as the price-to-earnings ratio (P/E), stock market valuations are elevated. This is hardly a controversial statement when considering the S&P 500 Index is trading at a P/E of 22 times the consensus earnings estimate for the next 12 months (source: FactSet). Even against the 2022 consensus earnings estimate, which may be a better measure given the strong earnings growth anticipated this year and next, the P/E of 20 is still several points above the long-term average of 17 since 1980. By that measure, we would say a lot of good news is priced in.
Valuations Look Quite Reasonable When Factoring In Rates
But we shouldn’t evaluate stock valuations in a vacuum. Going back to your Finance 101 days, the fundamental value of a stock is the present value of its future cash flows. When we discount future cash flows—a similar but purer measure of profits—interest rates come into play. That means we want to incorporate interest rate levels into our evaluation of P/E ratios. History shows higher interest rates have translated into lower stock valuations—and lower rates, our current situation, justify higher valuations.
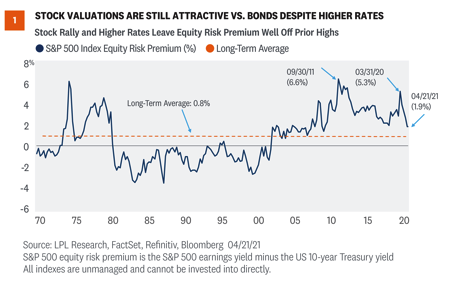
To get this fuller picture, we calculate what’s called an equity risk premium, or ERP. This statistic compares the earnings yield on the S&P 500 (the inverse of the P/E) to the 10-year US Treasury yield. Essentially, an ERP compares the earnings generated by stocks to the income generated by bonds (in this case, the yield on the 10-year Treasury). By putting stocks and bonds in the same terms, they can be compared on an apples-to-apples basis.
As of April 21, 2021, the ERP for the S&P 500 Index was 1.9%, which is above the long-term average of 0.8% but well below the post-pandemic peak of 5.3% on March 31, 2020 [Figure 1]. (Higher values mean stocks are less expensive relative to bonds, and vice versa.) Using the earnings estimate for the next 12 months rather than the last 12 months pushes the ERP up to an even more compelling 3%. So, while we acknowledge stock valuations are elevated, compared to still-low interest rates they are quite reasonable.
Inflation Is Also A Factor
Stock valuations have also been impacted by inflation levels historically. This makes sense because higher inflation tends to bring higher interest rates along with it. In essence, higher inflation reduces the value of future profits and cash flows, and therefore leads to investors paying less for those profits and cash flows in the form of lower valuations. This relationship is shown in [Figure 2], where you can see that low inflation (2% or less, based on the consumer price index, or CPI) has historically coincided with the highest P/Es.
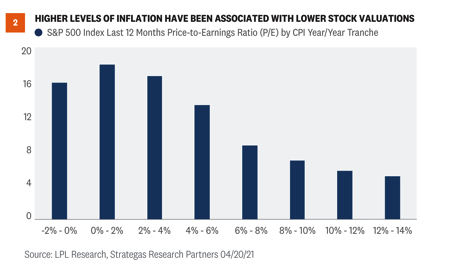
While we expect inflation to move above 2% due to stronger economic growth, tightening labor markets, and the base effects associated with depressed price readings early in the pandemic, valuations have historically been above average in the 2% to 4% inflation tranche, which eases our concern. In addition, we would expect higher inflation to be temporary. So, after the pandemic is further in the rear view mirror and the readings normalize, valuations may garner some support. We discussed why higher inflation may be transitory here.
Other Valuation Considerations
We believe the aforementioned valuation metrics paint a relatively full picture, but there are several other considerations.
• Watch cash flows. Getting a bit technical, cash flows matter more than earnings, which are an accounting measure that can be distorted. Free cash flow yield (cash flow left after capital investment versus price) is about 4.1% for the S&P 500 right now. That reading is higher, i.e., cheaper, than the average in the 1990s and not too much pricier than the 30-year average of 4.9%. But again, rates were higher during most of that 30-year period, which we believe supports lower free cash flow yields we are seeing in the current lower-rate environment. And cash flows remain depressed by the economic cycle, which inflates current valuations. We expect cash flow growth over the next 12 months will make stocks look even more attractive on this valuation metric.
• Efficiency boom. The tech boom in recent decades has enabled companies to do more with less. Fewer employees and less capital equipment are needed to run many businesses today—particularly technology and internet businesses. That enhances return potential for tech-savvy operators, which shows up in higher returns on assets and higher returns on invested capital. For example, Amazon’s return on assets in 2020 was 7.8%, compared with 5.5% for Walmart. And Amazon’s return on invested capital last year was 14.1%, compared with Walmart’s 9.7%.
• Tax rates matter. Dividend and capital gains tax rates combined averaged 42% during the 2010s, compared to 106% in the 1970s, 70% in the 1980s, and 63% in the 1990s. Higher tax rates impact investors’ expectations for after-tax returns, which we believe helps justify above-average stock valuations over the past two decades and currently. At the same time, the possibility that these tax rates increase next year, as President Biden has proposed, could cause valuations to narrow.
• Valuations are not good short-term timing tools. Remember that in the short term, valuations are not good timing tools. Historically, there has been little relationship between price-to-earnings ratios and subsequent one-year returns. So, while we want to be mindful of valuations, they are only part of the picture. They have historically begun to become useful as timing tools when time horizons are extended to at least three years.
Conclusion
Stock valuations are elevated right now, and a lot of good news is priced in. However, we believe valuations are quite reasonable when considering interest rates are low and we expect inflation to remain largely contained. Investors are appropriately optimistic in our view, given the backdrop of a dramatically improving economy, the rapid pace of vaccinations in the U.S. that is facilitating the reopening, massive levels of fiscal and monetary stimulus, and surging earnings.
We see further upside potential for stocks between now and the end of the year—although the pace of gains is likely to moderate relative to the 11% year-to-date advance for the S&P 500. We acknowledge our year-end fair value target range for the S&P 500 of 4,050–4,100 may prove to be conservative and are considering higher targets. We continue to recommend investors overweight equities and underweight fixed income relative to their targets, as appropriate.
Jeffrey Buchbinder, CFA, is an equity strategist at LPL Financial.