


The most easily identifiable indicator of volatility is the VIX Index, which measures the cost of using options as insurance against declines in the Standard & Poor’s 500 Index, a measure of the broad stock market. The VIX Index has fallen sharply over the past year and a half, from the mid-30’s in the fourth quarter of 2011 to 13 in May 2013, and is now well below the average (by more than 1 standard deviation†).
Is The Shift Sustainable?
 Certain pundits suggest we have entered a new volatility regime – that volatility has been tamed by the massive amount of liquidity injected into worldwide capital markets by very accommodative central banks. We take a different view. While volatility has been declining across many asset classes, it is creeping into several that may have escaped some investors’ attention.
Volatility Raises Its Head Elsewhere
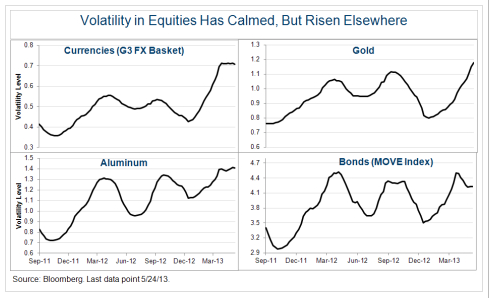
While the VIX remains quiet, currencies, commodities, and, to a lesser extent, bonds, have picked up the volatility baton on a rolling three-month basis. Volatility levels in the G3FX currency – a basket of currencies that includes the US Dollar (USD), Euro (EUR), and Japanese Yen (JYP), gold, and industrial metals (copper & aluminum) – while still within 1 standard deviation of their historical norms, have been rising relative to the VIX since 2010.
In the charts below, we map this relationship. Since the third quarter of 2011, the ratio of G3FX, and, separately, gold, aluminum and bonds against the VIX has hit new highs. Fixed-income bond volatility, as measured by the MOVE Index, is near the high end. The MOVE Index is a basket of 2-, 5-, 10- and 30-year Treasury bonds, and has recently surged from 49.04 on May 3rd to 81.22 on May 30th.
Indeed, within the G3FX basket, USD/JPY volatility is now 1 standard deviation above the mean. History shows the key winning trade would have been to go long on VIX volatility and to short the JPY, not a trade a sane person would make based on a decade of rising volatility in equity markets and the inscrutable stability of the yen.
We think so. We believe the fundamental drivers behind U.S. equity markets remain supportive of a continued rally, although more modest, during the second half of 2013. G4 central banks the Bank of England (BOE), Bank of Japan (BOI), Federal Reserve (Fed), and the European Central Bank (ECB) will continue to inject liquidity, thus helping to support asset prices and providing a floor for any slowing of global growth. We estimate the G4 central banks will inject $1.5 trillion, or nearly 5 percent of GDP. Corporate balance sheets also remain in great shape and earnings/profitability remains healthy. If we see the “great rotation” into equities materialize, that will further help contain equity volatility.
We believe a multi-year USD bull market has commenced, and that this is likely to push volatility in currencies higher as the rally gains momentum. A less accommodative Fed, relative to U.S. growth outperformance, improving twin deficits (current account and fiscal balance) and slowing USD diversification by central banks are the factors driving broad-based USD strength.
Gold will continue to remain under pressure as a stronger USD, a turn to positive U.S. Treasury real yields, and large retail positioning tarnish the shiny yellow metal.
Copper and aluminum volatility should pick up as concerns over global growth bubble from time to time. Also, China’s focus on rebalancing growth away from investment to consumption and the government’s continued crack down on shadow banking finance raises further concerns about Chinese growth and the country’s demand for commodities.
Fixed income – driven by Treasuries – is becoming more volatile, and we expect this to continue as we enter a new interest-rate regime. Improving economic activity, higher employment, and increased lending that will translate into greater monetary velocity will ultimately lead to higher inflation levels. The question that the market will grapple with is whether or not monetary accommodation by central banks will be removed in a timely manner, and how that will affect both fixed-income and other “risk-on” asset classes.
While we believe that the markets will ultimately accommodate this transition, the shift will result in higher volatility across a number of asset classes. They might not, however, be the ones investors are used to looking at!
†A measure of statistical variance from the average (mean), calculated as the square root of the variance, often expressed in 3 levels, with the first level encompassing 68 percent of all measurements in the time period.
Paresh J. Upadhyaya is Director of Currency Strategy, U.S. He leads Pioneer Investments’ currency research effort out of Boston and serves as an advisor to the firm’s global fixed-income and equity investment staff on currency-related issues. In addition, he helps lead sovereign credit analysis and advises the investment team on sovereign bond investments.
Mike Temple is responsible for oversight of Pioneer Investments’ U.S. credit research department. His duties include independent research of credits, sector analysis, and coordination of research efforts in high yield, bank loan, investment grade, emerging markets, and municipal credit. He has been the Portfolio Manager of an institutional “Credit Opportunity” strategy since 2008, and is also a Portfolio Manager of Pioneer Absolute Return Credit Fund.
Is Volatility Dead? Hardly.
June 6, 2013
« Previous Article
| Next Article »
Login in order to post a comment