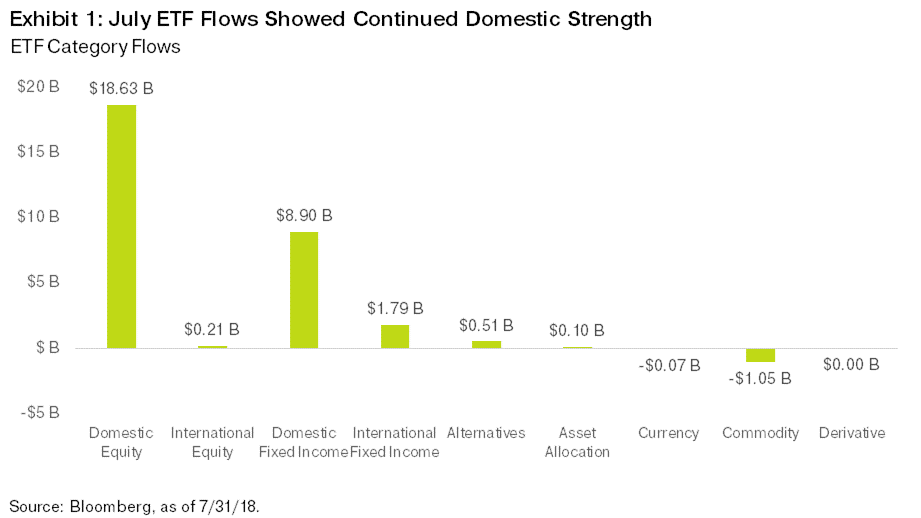
After shedding nearly $2 billion in ETF assets under management (AUM) during choppy June trading, July flows staged a strong comeback, with nearly $30 billion net coming in the door. The month of solid inflows has brought the year-to-date total to $153 billion, but it’s nearly 45 percent below last year’s pace. At this point in 2017, we had $272 billion in net new flows.
Looking back to 2016 provides some context. By this point in 2016, ETFs took in $111 billion in net new assets. While we trail 2017’s total, we are well ahead of 2016’s pace, making it a solid-but-unspectacular year so far.
High-Level View Stays Thematically Consistent
July’s markets and ETF flows generally followed the trends set to date in 2018. Healthy corporate earnings provided a steady backdrop for U.S. equities to continue functioning as the best game in town. As of July 27, 83 percent of S&P 500 companies that had reported earnings beat their estimates. If that number holds for the entire index, it will be the highest percentage of earnings beats since FactSet began aggregating the figure in 2008. Simultaneously, U.S. annualized GDP growth came in at a strong 4.1 percent for the second quarter, much stronger than the Eurozone economy, which reported an annualized 1.4 percent growth rate. In fact, this divergence in GDP growth rates between the two regions created the widest differential since 2014.
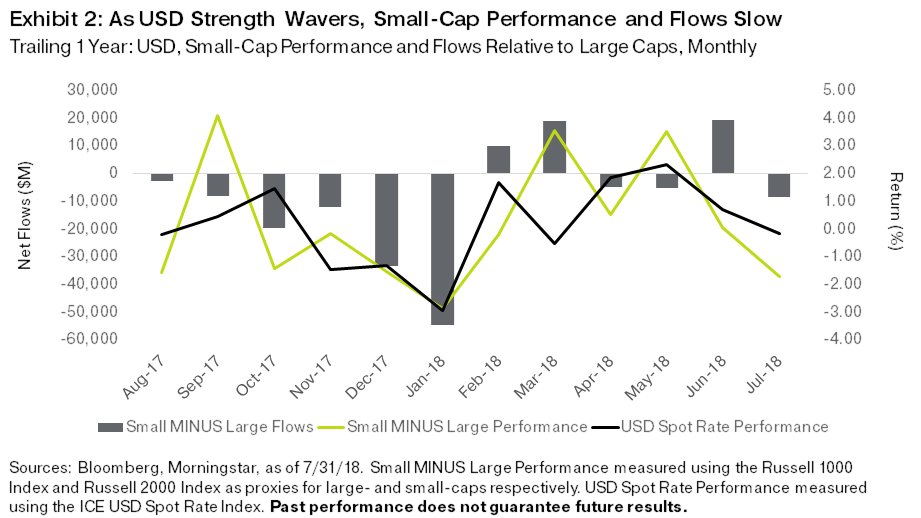
Small-Cap Trade Losing Steam
Given the combination of steadily rising rates and fiscal stimulus reverberating into an already strong U.S. economy, the U.S. dollar has had a fantastic run this year relative to both developed and emerging currencies. Yet the strong dollar eased and marginally changed course in July, as the White House vocalized concerns about this stronger dollar acting counter to their stringent global trade efforts. Small caps have largely followed the dollar this year, and after four straight months of outperforming their large-cap peers, they were shoved to the sidelines, underperforming large caps by nearly 2 percent in the month of July alone. With just a hint of weakness, we saw money pour out of small-cap ETFs—the category lost $8.5 billion relative to large caps, the most since January of this year.
Investors Return to the Value Well as Growth Stocks Take a Dive
The market has been all about growth stocks since the start of 2017. From January 2017 through July 2018, growth has outperformed value by a whopping 27.6 percent. This performance differential has brought with it some lofty expectations for growth companies, and certain growth investors lost big in July as Facebook tumbled significantly on slowing user growth and a disappointing outlook. This fueled a rotation of sorts at the end of the month to value stocks—the last full week of July was the best week of 2018 for value stocks relative to growth stocks. In fact, the greater-than 4% outperformance of value over growth during the three-day period from July 26 through July 30 was the best we’ve seen in 10 years. ETF investors certainly took notice: Exhibit 3 highlights weekly flows and performance of value relative to growth, and the rush of money that traded from growth to value during the last week of July.

High Yield Flows Are Back … But What Side Are They On?
High-yield ETF flows have been an interesting segment to monitor this year. On an absolute basis, rising rates have certainly hurt performance, but credit spreads continue to narrow, making the segment a strong relative performer in a challenging year for fixed income. Yet ETF investors certainly have not been convinced, and high-yield ETFs saw net outflows of nearly $4.5 billion through June 30. In July, however, high-yield ETFs came back in vogue and had their best month since July 2017, with nearly $2.3 billion in net new flows.
Zeroing in on high-yield ETFs with greater than $1 billion in AUM offers a different picture, however. Short interest levels (shares that have not been closed out in a short trade) ended the month of June at 26 percent of collective shares outstanding, a record for the category. Not only have ETF investors largely dumped high-yield funds this year, but any ETF inflows have been partially due to short selling. As retail investors exit with a steady headwind of rising rates, institutional investors are currently taking a tactical view that record tight credit spreads may (finally) start to widen a bit – all continued bearish warning signs from the ETF market.

Emerging Market ETFs Crawling Out from the Depths
Emerging market outflows are another trade that is perhaps starting to stabilize and turn a corner. The broad MSCI EM Index returned 2.2 percent in July, its first positive month since the start of the year. But investors are still hesitant to dive in, with only $412 million in net inflows into EM assets during July, a paltry figure compared with January’s raucous inflow of nearly $15 billion. The global trade war certainly hasn’t helped sentiment this year—we found an inverse relationship between the number of Google searches for the word “tariff” and emerging market ETF flows. We think sentiment around global trade fears will continue to act as a near-term indicator of category interest.

The month of July saw hot trades change course, including small-cap underperformance, value outperforming growth, and international markets starting to regain health, although they are still lagging the United States. The question for investors may be whether these newfound cracks in the momentum trade are glimpses of a new regime coming into play or simply a blip on the radar. As July’s strong ETF flows proved, regardless of what trends take shape, ETFs continue to offer liquidity and access to many different segments of the market, keeping the investment vehicle on a continued and steady upward growth trajectory.
David Mazza is head of ETF investment strategy at OppenheimerFunds. Christopher Clark and Sam O'Connell from OppenheimerFunds Beta Solutions team also contributed to the article.