


Against the backdrop of extremely low bond yields that looks set to continue and our expectation that we are also transitioning to an extended period of poor returns for U.S. stocks, in this commentary we examine the interplay between yields and valuations and how they influence our investing strategy. We then discuss the key drivers of subpar returns across many conventional asset classes before addressing the impact of changing return expectations on a so-called traditional portfolio, one split 60/40 between stocks and bonds. Lastly, we highlight how we are positioning our portfolios to maximize long-term returns.
Jeremy DeGroot is chief investment officer at Litman Gregory Asset Management.
An Increasing Amount of Government Bonds Have Negative Yields
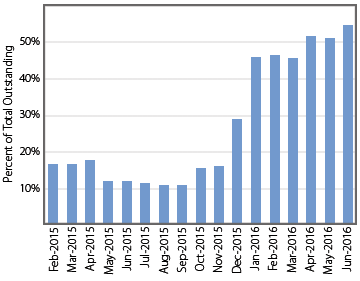
Source: © BCA Research 2016. Includes the government bonds of 18 developed countries.
The S&P Global Developed Sovereign Bond Index hit a new record-low yield of 0.4% as of June 30, 2016. Despite that, it has generated an 11% return so far this year in U.S. dollar terms. Also, as noted above, the amount of global sovereign debt with negative yields had reached $11 trillion by the end of June, accounting for roughly 55% of total outstanding government debt in developed countries. Low, let alone negative, current bond yields imply very low five-year expected returns for core bonds. However, as we have seen frequently over the past several years, and again earlier this year, they don’t preclude strong returns over shorter-term periods if bond prices are driven higher by investor fears, ongoing central bank bond purchases, and/or speculative short-term macro bets. Eventually though, the “bond math” catches up to you. In other words, you can’t escape the gravitational pull of the starting bond yield in determining your total return as a bond investor.
Similarly, starting stock market valuations (e.g., price-to-earnings multiples) have a historically strong inverse relationship to future market returns. That is, the higher the current valuation, the lower the future realized return. Another way to see this is that the reciprocal of a P/E multiple is an earnings yield (e.g., a 20x P/E ratio implies a 5% earnings yield). So high valuation multiples are the flipside of low yields.
Unlike bonds, which have a defined stream of cash flows (interest payments) and a set maturity date, stock market returns are subject to a much wider range of potential outcomes due to uncertainty and variation in earnings growth and valuation multiples. Wall Street analysts, and investors in general, have a very poor track record of predicting near-term earnings—as can be seen by their constant revisions to their forecasts. Valuation multiples are impacted by earnings fundamentals but are also driven by investor sentiment (put simply, greed and fear) and herd behavior, at least in the shorter term, making them unpredictable. Consequently, we never invest based on short-term stock market forecasts. We view them as no better, and probably worse, than a coin toss.
But even when looking out over longer-term (five- to 10-year) periods and market cycles—a period over which we believe fundamentals ultimately are reflected in market prices—we are very sensitive to the risk of “false precision” in estimating stock market returns. That is why we incorporate a range of plausible scenarios, assumptions, and potential outcomes in our analysis. Nevertheless, in looking at extended investment time horizons, it becomes clear: valuation matters. Higher valuations mean lower yields, which lead to lower expected returns.
A Traditional 60/40 Portfolio Has Unattractive Expected Returns
While we have frequently discussed our return expectations for U.S. stocks and core bonds, here we will discuss the return prospects for a traditional 60/40 portfolio. No matter how you slice it—in nominal or real terms, in absolute terms or relative to historical performance—looking out over the next five years, the return prospects are poor.
Rolling Five-Year Nominal Returns for the Traditional 60/40 Portfolio
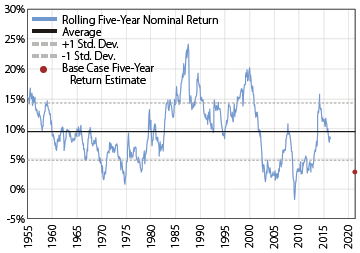
Source: Morningstar Direct. Data as of 5/31/2016.
Looking at some history, the chart at right shows rolling five-year annualized nominal returns for the traditional 60/40 portfolio (60% S&P 500 index and 40% core bond index), starting in 1950. We have assumed annual rebalancing back to the 60/40 weights. Over that period, the average annual return was 9.5%. The red dot in the chart signifies our base case return estimate for the 60/40 of roughly 2.5%–3%. This is derived from our current estimate of roughly a 4% return for the S&P 500 and a 1% return for core bonds over the next five years. As can be seen from the chart, a 3% annualized five-year return would be among the worst historical returns for the 60/40 portfolio. Of the 738 rolling five-year periods since 1950, only 67 have had a return less than 3%.
The results are much the same if we look at things in “real return” terms (net of inflation), as shown in the following chart. The historical average annual real return (i.e., each rolling five-year nominal return reduced by the inflation rate over that same five-year period) was 7.6%. In contrast, our base case expected real return is roughly 0.5%–1% (assuming 2% expected inflation). Of the 738 rolling five-year real return periods since 1950, only 53 have seen returns lower than 1%.
Rolling Five-Year Real Returns for the Traditional 60/40 Portfolio
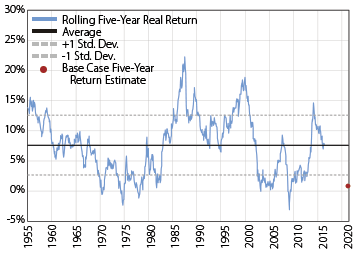
Source: Morningstar Direct. Data as of 5/31/2016.
Assuming our return expectations play out, investors in a traditional 60/40 portfolio will barely stay ahead of inflation. And they will earn around 6.5% less per year than the historical average 60/40 return, or 37% less cumulatively over the entire five years.
The historical charts also show the 60/40 portfolio has generated above-average returns over the past several years. A key driver of this strong performance has been the impact of quantitative easing (purchases of government debt in an effort to add liquidity to bond markets) and other aggressive central bank policies, which have helped push down interest rates. This has meant higher bond prices and capital appreciation for the core bond index in addition to its paltry income yield. Central bank policies also contributed to the meaningful increase in stock market valuations. This was one of former Fed Chair Ben Bernanke’s explicit objectives when the Fed undertook multiple bond purchase programs in the years following the financial crisis. Although there was a sharp V-shaped rebound in S&P 500 earnings off the extreme lows of the 2008–2009 financial crisis, which supported a rebound in stock prices, the hoped-for stimulative “wealth effect” for the actual economy barely materialized.
Multiple Expansion Has Been the Main Driver of Returns
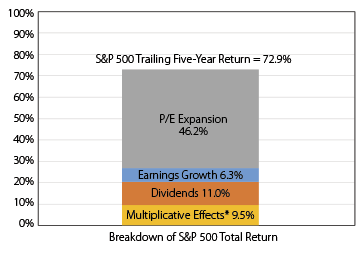
*The multiplicative effect accounts for the difference between summing the three return components instead of multiplying them to get to the total return number.
Source: Standard & Poor’s. Data as of 3/31/2016.
In more recent years, a significant majority of the S&P 500’s return has come from P/E multiple expansion rather than actual earnings growth. For example, for the five years ending March 31, 2016, the S&P 500 gained 73%, but 46 percentage points of that total return came from P/E expansion. Meanwhile, total earnings per share growth was just 6% over the entire period (i.e., 1.2% annualized). Dividends accounted for roughly 11%.
The 12-month trailing P/E of the S&P 500 is currently around 23x, compared to its median since 1950 of roughly 17x. As long as interest rates remain at extremely low levels, P/E multiples may remain higher than normal. If current interest rate levels are not sustainable—and we don’t think they are—then it is likely the valuation multiple will drop toward more normal historical levels. (If rates do stay at such depressed levels for the next five years, it likely means economic and earnings growth have remained quite depressed as well, which is unlikely to be bullish for stock market valuations.) Our base case scenario for U.S. stocks assumes a 17x multiple for the S&P 500, and we look at different scenarios and sensitivities across a range of multiples around that.
Yes, Stocks Should Still Return More Than Core Bonds . . . So What?
We constantly see market strategists point to very low bond yields as a reason to favor or overweight stocks versus bonds. While we have subpar return expectations for stocks, we also believe stocks are likely to generate higher returns than core bonds over our five-year horizon (absent a deflation/depression scenario) to the tune of roughly a 3% annualized return premium in our base case. However, as we always point out, you shouldn’t look at expected returns in a vacuum while ignoring the risk side of the equation. Stocks have significantly higher volatility, higher downside risk, and higher risk of permanent capital loss than core bonds. This seems like such an obvious point, but rarely do we hear these strategists make it. This being the case, you should always be compensated for this risk with a higher expected return from stocks compared to core investment-grade bonds. This is referred to as the equity risk premium. Of course, the fact that the expected return for stocks is higher doesn’t mean the actual return over a given time period will turn out to be higher. But why would anyone buy stocks if the expected return from owning low-risk bonds was just as good?
The actual average annualized five-year excess return for stocks over core bonds was 4.6%, going back to 1950. However, the average equity return premium has fallen to 3.4% over the past 30 years—close to our current expected premium of 3%. There have been several periods where the actual equity risk premium was negative—clearly not the market’s expectation at the beginning of those periods!
Informed investors can reasonably disagree about whether the current expected excess return from owning stocks over bonds is sufficiently high to justify overweighting stocks versus bonds (or conversely whether it is too low and therefore favors bonds versus stocks). But to state that if you believe stocks are going to return more than bonds over the next year, you should therefore hold more stocks and less bonds than you normally would strikes us as overly simplistic and potentially dangerous to one’s financial and mental well-being. Presumably, people who normally hold bonds in their portfolio are more sensitive to shorter-term market volatility and losses, and therefore own bonds to mitigate risk. It is not a simple comparison of which asset class is likely to return more, because the certainty of that outcome is nowhere near 100%, especially over shorter-term periods. Even over longer-term periods, where stocks are much more likely to beat bonds, the path to that long-term outcome will assuredly not be a smooth one. This creates the conditions for more conservative, risk-averse investors with too much stock exposure relative to their risk tolerance to harm their long-term returns by reducing their stock exposure at exactly the wrong times—during the inevitable market selloffs and cyclical scares. In the long run, a larger allocation to equities actually makes these types of investors worse off.
In addition to the relative return premium you should get from owning stocks versus core bonds, we also believe there is a minimum absolute equity return one should expect to earn in order to be fully compensated for equity risk and to be “fully allocated” to equities. (For a client with the risk tolerance appropriate for a 60/40 portfolio, “full” equity exposure is 60%.) Our absolute-return hurdle for the U.S. stock market is an upper single-digit return. If expected returns are in that ballpark, we consider the stock market to be within its “fair value range” (again, we avoid over-reliance on a single point estimate), and all else equal, we will be fully allocated to stocks in our balanced portfolios. (Our four balanced portfolios contain differing exposures to fixed-income securities and equities with the key determinant of weightings being investor risk tolerance and desire for capital preservation versus willingness to assume greater risk for potential higher long-term returns. They are structured and managed so as to limit losses to pre-specified percentage thresholds.)
Our current analysis suggests U.S. stocks are trading above their fair value range with expected returns in the low single digits (or worse), except in our optimistic scenarios. Therefore, we are underweight U.S. stocks. Because expected returns for core bonds are also quite unattractive, we are also underweight to them. Instead, we are invested in what we believe is a much more attractive mix of asset classes and strategies that our analysis suggests have much more attractive return potential. These assets, along with some exposure to U.S. stocks and core bonds, can be combined in a well-diversified, risk-managed portfolio with comparable risk to a traditional 60/40 portfolio, but with a much better five-year expected return.
Portfolio Positioning
We are underweight to U.S. stocks, in favor of a mix of developed European and emerging-markets equities. Our analysis and modeling suggests both these broad markets offer attractive five-year return potential, driven by improving earnings growth and expanding valuation multiples. We don’t discount the higher potential downside risk and volatility from these markets, but unlike our expectations for U.S. stocks, we believe we are being fully compensated for taking on these near-term risks, with low double-digit expected returns in our base case.
Part of our underweight to U.S. stocks in our balanced portfolios is also allocated to liquid alternative strategies, including managed futures and arbitrage strategies. With these investments, we generally expect to get returns comparable to or better than U.S. stocks but with much less downside risk. So these are portfolio diversifiers that improve the overall potential risk-adjusted return.
Turning to the fixed-income side of the portfolio, we are underweight core bonds in favor of actively managed, flexible, unconstrained, and/or opportunistic fixed-income funds. We expect to earn a meaningful return premium from these funds relative to the core bond index over the next several years. In exchange for the higher expected returns, we know we are taking on more credit risk and that they won’t hold up as well if there is deflation or a short-term flight-to-safety event or shock that pushes Treasury bond yields even lower. However, these flexible fixed-income funds have less sensitivity to negative price impacts from rising Treasury rates. Therefore, in addition to positive expected excess returns, they play a valuable risk-management role in our more conservative, fixed-income-heavy portfolios.
We also have a tactical position in floating-rate loan funds in place of some of our core bond allocation. Since they are of lower credit quality than core bonds, floating-rate loans do expose us to some credit risk, but they are less risky than high-yield bonds or stocks. They also offer attractive five-year expected annual returns (in the 6%–7% range), and they provide a portfolio hedge against inflation and interest rate increases because their yields reset higher as interest rates rise.
Finally, we have been long-term investors in select private real estate funds run by managers with the expertise and proven ability to take advantage of niche market inefficiencies. These managers have generated strong returns over time, and our outlook for these investments remains quite positive. Depending on the specific fund, we estimate potential annualized returns over the next three to five years will be in the low double digits in a base case scenario. While expected returns for these investments have come down on the heels of very strong performance over the past few years (as real estate market valuations have moved higher), we believe they are still attractive on an absolute risk-return basis, and very attractive relative to most other investment opportunities we see.
Putting It All Together
Given current yields, valuations, and earnings fundamentals, this more diversified 60/40 portfolio is not expected to generate returns as high as the long-term historical average, even with the nice additional return margin coming from our ability to tactically allocate to what we believe are much more attractive asset classes and strategies. Our base case expected annualized five-year return for our 60/40 portfolio as it is currently allocated, assuming a 10% allocation to private real estate, is in the 6%–6.5% range. That is meaningfully higher than the approximate 2.5%–3% return we expect for the traditional 60/40 portfolio.
Of course, there is no guarantee the base case will play out. There is a wide range of potential returns, depending on what scenarios actually unfold over the next several years. But we view our base case as being the most likely, and we believe our asset class assumptions are reasonably conservative.
Another important message is that, as always, investors should have realistic return expectations as they look out over the next five or so years at least. These return expectations should be based on current valuations and starting yields, and they should encompass a range of reasonable economic, fundamental, and financial market scenarios. Similarly, investors should also be cautious in assuming returns will mirror their long-term averages. There is no economic law that says 60/40 investors are owed that historical 9.5% annualized return.
Closing Comments
We believe patience, discipline, and the tactical flexibility and expertise to invest across a broad opportunity set will be important attributes for navigating the next five years. We doubt investors will be able to simply rely on the U.S. market tailwinds of declining interest rates and rising P/E multiples that have boosted returns for core bonds and stocks over the past several decades.
Volatile markets, which we also expect, will likely challenge investors’ convictions and emotions. As always, it is critical to do an honest self-assessment to understand your temperament, risk tolerance, and objectives, and to invest in a portfolio that is managed in a manner that is consistent with those attributes before market volatility strikes rather than in the heat of it, when emotions are likely to cloud judgment and lead to poor investment decision-making.
Successful investing requires patience and the understanding that investing is a part of a process, not a one-off decision, toward achieving your long-term financial goals; there will be inevitable and consistently unpredictable shorter-term market ups and downs along the way. Remaining focused on the long-term objective is key, as is maintaining a consistent investment discipline to guide your decisions over time. Our valuation-driven discipline means we can use short-term market volatility to our long-term benefit—managing risk while taking advantage of the investment opportunities created by other market participants’ lack of discipline, patience, and flexibility.
Low Yields, Low Returns
July 28, 2016
« Previous Article
| Next Article »
Login in order to post a comment