Headed in right direction. We have made real progress, but we do not yet have the virus under control. While the daily case growth rate is down to less than 3 percent, that still means that—absent further reductions—the total number of cases will double in the next four weeks or so. It should also be said that the current gains are not locked in stone. Premature policy changes or a failure of people to observe prudent behavior could unleash the virus again, which is a real risk of the current partial reopening of many states. We are headed in the right direction, but we are not there yet. We must keep that in mind as we look at the markets.
The Markets: What Happens Next?
Over the past several weeks, markets had the fastest onset of a bear market in history, followed by the fastest recovery into a bull market in history. In the past week alone, the S&P 500 is up about 4 percent. This kind of volatility is historic. But since it is unprecedented, we can’t really look back at history for guidance as to what happens next. We can, however, look at the present to see what that tells us about the market today.
Corporate earnings. The best way to do so is to look at what the market itself is telling us by comparing the recent volatility in stock prices with the expected changes in the underlying fundamentals: corporate earnings. The problem here is that we don’t know what earnings will be over the next year or two. But we do have estimates, and we can at least use those as a basis to figure out just how cheap—or expensive—stocks are based on those expectations. That calculation can provide a historical baseline.
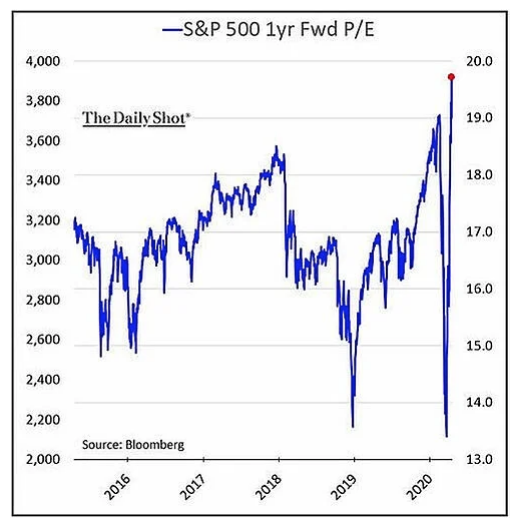
Using that baseline, we can see that when the markets dropped, based on the earnings expectations then, they became the cheapest since 2015. Since then, however, a combination of a market recovery and declining earnings expectations has resulted in the market being even more expensive—based on next year’s expected earnings—than it was at the peak earlier this year and more expensive than at any point in the past five years.
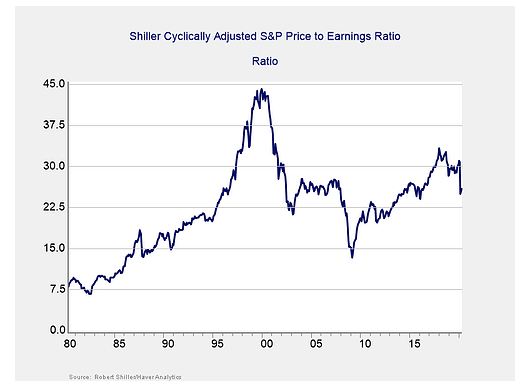
The Shiller ratio. While concerning, the problem here is that this analysis relies on earnings estimates, which can change and are certain to be wrong. To balance that shortcoming, we can also use a different metric that relies only on historical data: the average earnings over the past 10 years rather than estimates of the future. Because it uses averages over a 10-year period, this metric is less influenced by the business cycle or the abnormalities of any one year. It was popularized by economist Robert Shiller and is known as the Shiller ratio.
The chart below (as of the end of March 2020) shows that despite the sharp drop, valuations closed March at about the level of the peak before the financial crisis. As prices have recovered through April, that ratio has moved even higher. Just as the chart on forward earnings showed the market to be very expensive, this one shows the same based on historical data.