Market Returns And Retirement Income
The general problem with attempting to gain insights from the historical record is that future market returns and withdrawal rates are connected to the current values of the sources for market returns. Future stock returns depend on dividend income, on the growth of the underlying earnings and on changes in the valuation multiples placed on those earnings. If the current dividend yield is below its historical average, which it is, then future stock returns will also tend to be lower.
When price-earnings multiples are high, markets tend to exhibit mean reversion, so relatively lower future returns should be expected. Returns on bonds depend on the initial bond yield and on subsequent yield changes. Low bond yields will tend to translate into lower returns because there is less income and because there is a heightened interest rate risk associated with capital losses if interest rates rise.
The reality for today’s retirees is that interest rates are very low and stock market valuations (as measured by Robert Shiller’s cyclically adjusted price-earnings ratio “P/E 10”) are high. Sustainable withdrawal rates are intricately related to the returns provided by the underlying investment portfolio. The returns experienced in early retirement will weigh disproportionately on the final outcome. Current market conditions are much more relevant than historical outcomes.
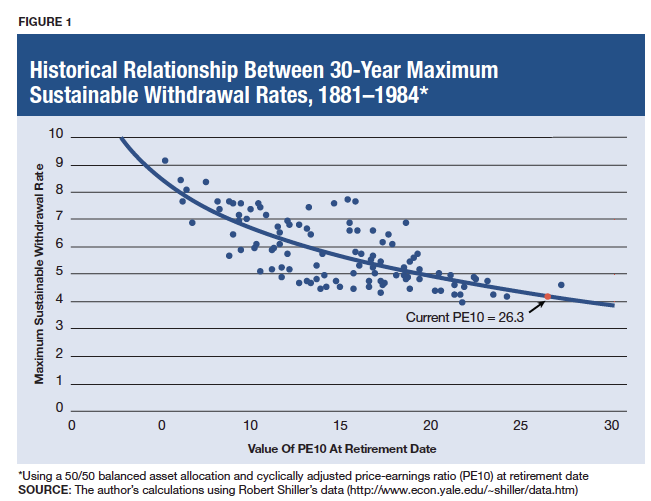
To help illuminate this matter, Figure 1 plots the historical maximum sustainable withdrawal rates over 30-year retirements using a 50/50 asset allocation, against PE10, at the retirement date. Historically, market valuations have performed fairly decently in explaining subsequent sustainable withdrawal rates. Without incorporating the role of any other variables, retirement date market valuations explain 53% of the historical fluctuations in withdrawal rates.
In the figure, I also include a best-fitting curve for the historical data. On June 27, 2014, the PE 10 was 26.3. The curve suggests that a best guess about the sustainable withdrawal rate for someone retiring today is 4.2%. It is important to emphasize that this is not a conservative guess about a safe withdrawal rate but the best guess based on the historical relationship between withdrawal rates and market valuations. It could end up being more or less, which we will not be able to confirm for 30 years. To be conservative, a lower withdrawal rate is required. This is especially the case when we consider that interest rates are also low.
What about interest rates? Using wholesale pricing data from The Wall Street Journal for June 27, 2014, I estimate that buying $10,000 of real income for 30 years using TIPS would cost $268,844. This implies a 3.72% withdrawal rate from retirement date assets, which is really the closest we can come to estimating a truly safe 30-year inflation-protected withdrawal rate (ignoring that today’s retirees may end up living beyond 30 years). I must re-emphasize here that because of the portfolio volatility, using a 50/50 portfolio could result in a sustainable withdrawal rate that is less than this, so the withdrawal rate is safe only if holding individual TIPS to their maturity. Meanwhile, using Treasury Strips and incorporating an assumed annual inflation factor of 3%, 30 years of income would cost $285,222, which represents a 3.51% withdrawal rate from retirement date assets.
As for bond funds, today’s yields are the best predictor of subsequent returns. Increasing interest rates would mean higher subsequent bond fund returns, but also capital losses for the bond fund in getting to that point. Which factor looms larger for a client depends on how the duration of the bonds compares with the duration implied by the retirement spending needs. Nonetheless, one should be cautioned against estimating higher withdrawal rates from portfolios of bonds than the numbers described earlier, as any stretch toward higher yields by tilting toward lower credit quality or longer maturities increases the risk for the bond portfolio.
The payout rate from an income annuity is determined by mortality forecasts and the current interest rate environment. Annuitized assets are generally invested heavily in fixed income. When interest rates are low, the payout rates for income annuities will also be low. Using Cannex, I find that the current best deal for a CPI-adjusted joint and 100% survivor income annuity for a 65-year-old couple is 3.85%.

Now Is A Tough Time To Retire
September 2, 2014
« Previous Article
| Next Article »
Login in order to post a comment
Comments
-
For those clients who qualify and can afford it, put them in a LTC contract to cover high, end-of-life costs. Then they can withdraw 6-8% annually from the remainder of their portfolio. I've been recommending that for nearly 20 years and no one has run out of money. Nor does it appear that they ever will. Also being debt free, which is my #1 advice, gives lots of flexibility should something go wrong (2000/2008).
-
A participating lifetime income annuity would solve for today's low interest rate and future inflation risk concerns. It just so happens that a quiet giant mutual insurance company has now addressed those concerns with its participating lifetime income annuity. The annuity is eligible for annual dividends which can be taken in cash to increase current year income, or, be deferred to purchase guaranteed income additions. And, it actually pays a portfolio 2014 dividend rate of 5.50%, on top of it's guaranteed 2% income floor. Dr Pfau would be pleased to learn of this unique and exciting advancement in lifetime income planning.


