The reality of writing a regular blog is that sooner or later you’ll repeat yourself. For the umpteenth time in recent memory, volatility has slouched to a level that should set off at least a few alarm bells. Markets have been eerily calm of late, with the VIX Index, a commonly used measure of U.S. equity volatility, currently in the low teens.
Volatility is not just low in an absolute sense. More importantly, it is too low relative to the factors that have historically driven market volatility. Those include:
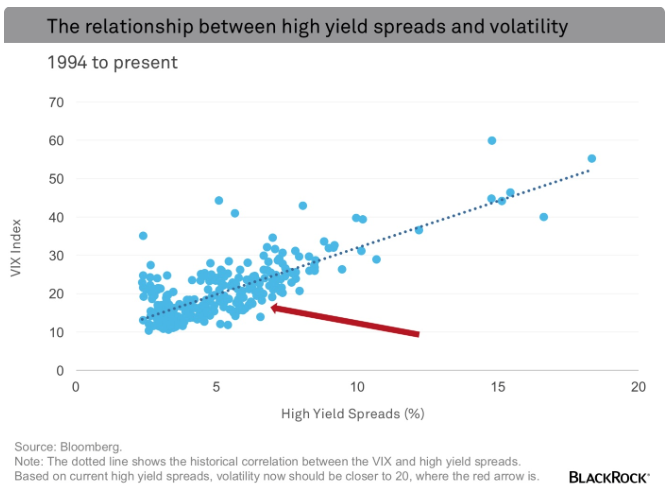
Credit Market Conditions
Credit market conditions have historically had the tightest correlation with market volatility (see the dotted line in the chart below). When credit markets are struggling, indicated by wider spreads, volatility is almost always elevated. High yield spreads have come in dramatically since the January panic, but volatility has declined at an even faster rate. Based on high yield spreads, which have historically explained about 60% of the variation in the VIX, volatility should be closer to 20 (see the arrow in the chart below) than the low teens.
Economic Conditions
Markets are more likely to be calm when economic conditions are improving. In contrast, recessions almost always correlate with down markets and rising volatility. That is why the VIX Index has historically correlated with leading indicators. Since 1990 the level of the Chicago Fed National Activity Index (CFNAI) has explained nearly 25% of the variation in the VIX. While the CFNAI has stabilized, it still suggests that the VIX is roughly 25%-30% too low.
Time Of Year
I’m hesitant to include this category; investors tend to overestimate the importance of seasonal effects. Most are a function of noisy data rather than well-established phenomenon. That said, as I’ve written about in the past, the one exception appears to be the fall, more specifically September, when markets do tend towards weakness. As stocks sell off, volatility is typically higher. Over the past quarter century the VIX has averaged over 22, the highest of any month, in September.
Other than seasonality, none of the above provides much information on when volatility will revert to something closer to fair value. The best clue is likely to come from a familiar source: the Federal Reserve (Fed). Volatility has leaned towards being undervalued for much of the past five years. To my mind this is largely a function of ultra-accommodative monetary conditions. To the extent the Fed tightens a bit faster than the languid pace discounted by markets, that would likely be a catalyst for some mean reversion in volatility.
When and if that does occur, investors should probably expect at least a 5%-10% correction. Historically, the S&P 500 has declined by around 1.3% for each one point rise in the VIX. Should the VIX over-correct and rise back towards the highs hit in January, investors could be looking at something more nasty. The difference between these two scenarios: the Fed’s willingness to allow monetary policy to revert to something resembling normal.
Russ Koesterich, CFA, is head of asset allocation for BlackRock’s Global Allocation team.