2016 was a terrible year for the performance of active stock pickers. According to Bank of America Merrill Lynch, 81% of US Large Cap active funds underperformed their benchmark . Although we doubt that stock pickers will continue to underperform quite as badly as they did last year, investors seem to be waking up to the inherent performance problems for traditional active managers. It is difficult for every stock picker to outperform when there are so many stock picking funds and so few managers willing to take sizeable risks within their portfolios.
We are not stock pickers at RBA. We have never made a claim to be able to differentiate stock A from stock B, and will never make such a claim. Rather, our performance is based on meaningful macro positions based on asset allocation, size, style, geography, quality, and other market segments.
Pactive investing, the active management of passive investments like ETFs, is RBA’s specialty. The growing breadth and depth of the ETF market leads us to believe that RBA is uniquely positioned to combine the most important aspects of both passive and active management.
Passive investments are NOT a panacea for poor active management
When we started RBA in 2009, we emphasized that the firm was a manager of beta. Alpha is important, but if one doesn’t make superior beta allocations, then alpha can be totally irrelevant. For example, an active, stock picking manager might outperform a benchmark by several hundred basis points, but if the benchmark’s return was -20%, then the investor nonetheless received a substantial negative return. At RBA, we drive our alpha through beta allocation, i.e., through macro decisions rather than through individual stock selection.
Investors’ returns during the “lost decade” in equities were a perfect example of poor beta management. The widely held view during the late-1990s was that “stocks for the long term” was a winning strategy, and that one couldn’t go wrong with a simple S&P 500® index fund. Unfortunately, the S&P 500R underperformed many other stock indices during the next 10 years. The idea that a passive investment, in this case an S&P 500® index fund, was a definitive route to better returns was clearly wrong because investors had forgotten the most important decision was which index fund to buy and when!
Today, ETFs are considered a solution to inferior active returns, but the problems regarding which ETF to buy and when to tactically buy them will likely continue to be a significant challenge. Chart 1 shows the relative performance between small cap and large cap US stocks (the Russell 2000® vs. the S&P 500®). Small caps were outperforming large caps when the line is going up, and vice versa. Small cap relative outperformance peaked in mid- 1984, and then proceeded to underperform for most of the next 15 years.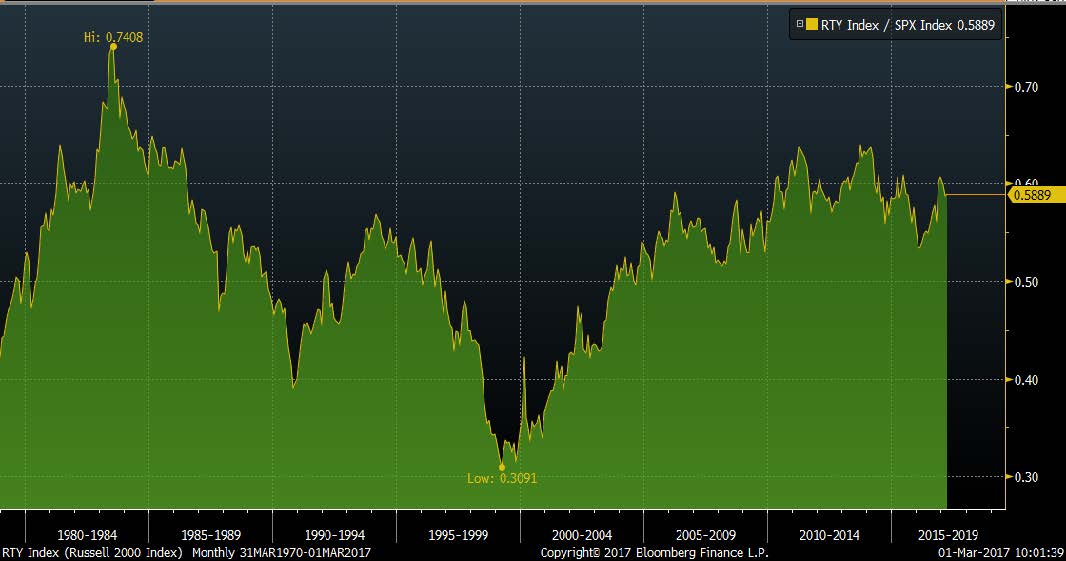 Source: Bloomberg Finance L.P.
One might say this is an extreme and very long-term example, but there are many shorter-term examples we could cite. Chart 2 shows a more recent example between Emerging Market stocks and US stocks. Coming out of the 2008 bear market, most asset allocators favored Emerging Market stocks over US stocks. However, a portfolio allocated to Emerging Markets anytime from 2008 to 2011 would have significantly underperformed one allocated to US stocks.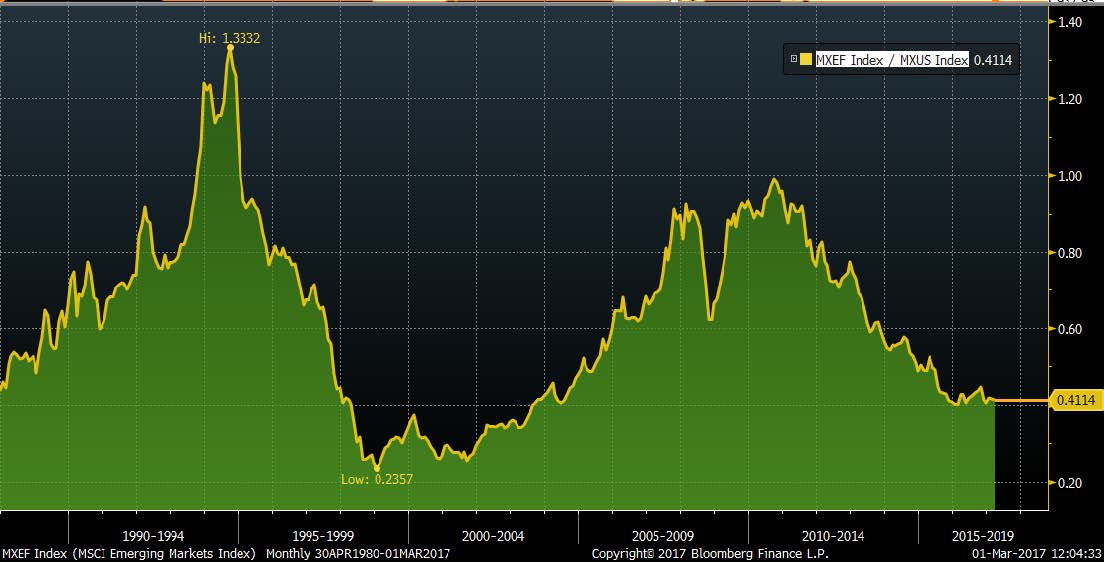 Source: Bloomberg Finance L.P.
Although many profess to be “long-term investors”, the turns in asset class leadership can be very meaningful even year by year, and often have a backward-looking effect on investor positioning. Chart 3 shows asset class performance during 2015 when global profitability was waning versus asset class performance in 2016 when global profitability was accelerating. Some of 2015’s worst performing asset classes became 2016’s best performers. Investors should clearly have a long-term strategic investment plan, but tactical allocation can have a consequential impact on portfolio performance.
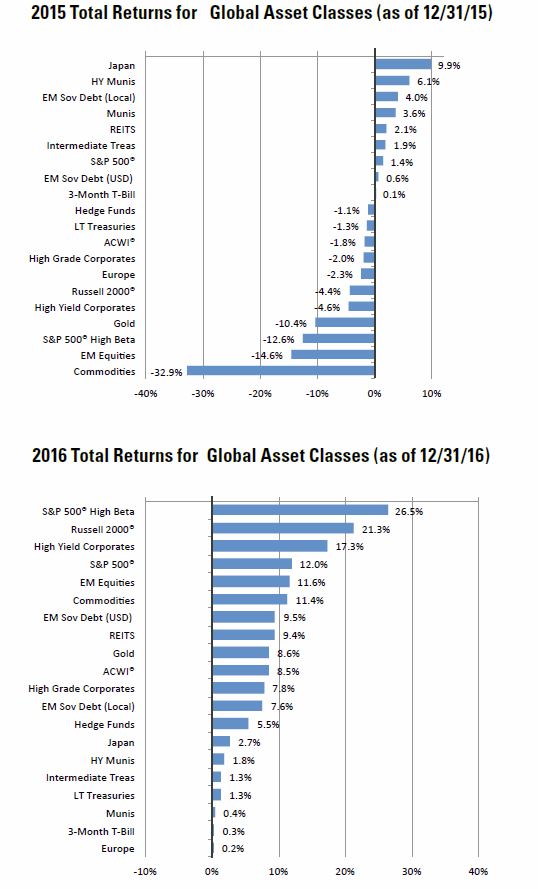
Source: Richard Bernstein Advisors LLC, MSCI, HFRI, Standard & Poors. BofA Merrill Lynch, Bloomberg. For Index descriptors, see “index Descriptions” at end of document.
Anyone can do this!...Maybe not.
One might think that allocation of ETFs is easier than picking active managers, and therefore, anyone can be a Pactive® manager. Several points suggest otherwise:
1. RBA has trademarked Pactive® because we feel our macro-based approach to investing is quite unique. For more insight as to how RBA approaches ETF selection and allocation, please see this earlier report. http://rbadvisors.com/images/pdfs/Whats_in_your_ETF_Portfolio.pdf
2. Regardless of whether one uses passive ETFs or active mutual funds one must remember that both are simply portfolios of assets. Investors’ general inability to tactically allocate active funds seems likely to translate to an inability to tactically allocate ETFs.
3. Dalbar data supports our contention in the second bullet. The “typical investor” has performed very poorly over the past 20 years (see Chart 4). The “typical investor” will likely be similarly unsuccessful when tactically picking ETFs as they have been when picking mutual funds. Most investors tend to buy high and sell low. Why would that behavior be any different when they invest in ETFs?

Source: Richard Bernstein Advisors LLC., Bloomberg, MSCI, Standard & Poor’s, Russell,HFRI, BofA Merrill Lynch, Dalbar, FHFA ,FRB, FTSE. Total Returns in USD. Average Investor returns are represented by Dalbar’s investor returns which represent the change in total mutual fund assets after excluding sales, redemptions and exchanges.
Fees play a major role in performance
A 2014 SEC report (https://www.sec.gov/investor/alerts/ib_fees_expenses.pdf) outlines the effects that manager fees can have on long-term performance. The report demonstrates that even small increases in manager fees can have a significant detrimental effect on wealth building.
Pactive® strategies are relatively low fee strategies largely because there is no need to support a substantial analyst infrastructure necessary to research hundreds, if not thousands, of individual companies. We feel the potential improvement in performance versus the Dalbar performance history would more than compensate for the strategies’ relatively low fees.
In addition, Pactive® portfolios are transparent and liquid. The trend in many areas of investment management has been toward higher fees, less transparency, and investor illiquidity. Pactive® seems to push back on those trends.
Pactive® investing’s bright future.
Pactive® investing seems to have a very bright future for the following reasons:
1. It is a unique combination of active and passive management, i.e., the active management of passive investments.
2. It is tactical, and can take advantage of significant changes in asset class leadership.
3. It is relatively low fee active management.
4. It is transparent and liquid.
5. There is a skill involved to allocating ETFs. History suggests that most investors are quite poor at asset allocation and equity allocation.
For more information on RBA’s Pactive® strategies, please contact your local RBA Representative. (http://www.rbadvisors.com/images/pdfs/ Portfolio_Specialist_Map.pdf).
INDEX DESCRIPTIONS:
The following descriptions, while believed to be accurate, are in some cases abbreviated versions of more detailed or comprehensive definitions available from the sponsors or originators of the respective indices. Anyone interested in such further details is free to consult each such sponsor’s or originator’s website.
The past performance of an index is not a guarantee of future results.
Each index reflects an unmanaged universe of securities without any deduction for advisory fees or other expenses that would reduce actual returns, as well as the reinvestment of all income and dividends. An actual investment in the securities included in the index would require an investor to incur transaction costs, which would lower the performance results. Indices are not actively managed and investors cannot invest directly in the indices.
S&P 500®: Standard & Poor’s (S&P) 500® Index.
The S&P 500® Index is an unmanaged, capitalization-weighted index designed to measure the performance of the broad US economy through changes in the aggregate market value of 500 stocks representing all major industries.
ACWI®: MSCI All Country World Index (ACWI®):
The MSCI ACWI® Index is a widely recognized, free-float-adjusted, market-capitalization-weighted index designed to measure the equity-market performance of developed markets.
ACWI® ex US: MSCI ACWI® excluding United States Index:
The MSCI World Index ex-US index is a free-float-adjusted, market-capitalization-weighted index designed to measure the equity-market performance of developed markets excluding the United States.
Gold: Gold Spot USD/oz Bloomberg GOLDS Commodity.
The Gold Spot price is quoted as US Dollars per Troy Ounce.
Hedge Fund Index: HFRI Fund Weighted Composite Index.
The HFRI Fund Weighted Composite Index is a global, equal-weighted index of over 2,000 single-manager funds that report to the HFR (Hedge Fund Research) database. Constituent funds report monthly net-of-all-fees performance in USD and have a minimum of $50 million under management or a twelve (12)-month track record of active performance. The Index includes both domestic (US) and offshore funds, and does not include any funds of funds.
3-Mo T-Bills: BofA Merrill Lynch 3-Month US Treasury Bill Index.
The BofA Merrill Lynch 3-Month US Treasury Bill Index is comprised of a single issue purchased at the beginning of the month and held for a full month. The Index is rebalanced monthly and the issue selected is the outstanding Treasury Bill that matures closest to, but not beyond, three months from the rebalancing date.
Long-term Treasury Index: BofA Merrill Lynch 15+ Year US Treasury Index.
The BofA Merrill Lynch 15+ Year US Treasury Index is an unmanaged index comprised of US Treasury securities, other than inflation-protected securities and STRIPS, with at least $1 billion in outstanding face value and a remaining term to final maturity of at least 15 years.
Richard Bernstein is chief executive and chief investment officer at Richard Bernstein Advisors.