Should stock investors sell now? It’s been a good year for stocks—the S&P 500 has returned 5.7% this year despite the drop on Friday. But has it been too good? Seven-and-a-half years into the bull market, valuations are high and we see little upside in stocks between now and year-end. Friday’s more than 2% drop was the S&P 500’s first drop of more than 1% since just after the Brexit vote on June 27, 2016, so we were due for a pullback. Add to that, September is a seasonally weak month. All of that begs the question, should you sell now? Certainly taking some profits or rebalancing portfolios according to your regular plan is prudent. But in this commentary we lay out reasons why selling now may not be the best move.
ARE STOCKS TOO EXPENSIVE?
We often hear that stocks are expensive. In fact, last week we noted that the S&P 500 price-to-earnings ratio (PE) using the median calculation is more than 50% above its long-term average. Traditional market cap weighted valuations are also high — the current PE of 18 (trailing four quarters) is above the average of 15.2 going back to 1950, and even above the higher post-1980 average of 16.4.
But are high valuations a reason to sell? We don’t think so. Valuations have not been good predictors of stock market performance over the subsequent year, as shown in Figure 1. (If the dots in Figure 1 formed something resembling a straight line, more like Figure 2, it would be more indicative of a relationship.) The correlation between the S&P 500’s PE and the index’s return over the following year, at -0.31, is relatively low (based on 45 years of data). Stocks can stay overvalued longer than we might think they should, so we encourage investors to focus more on macroeconomic, fundamental, and technical factors, not valuations, for indications of an impending market correction or bear market.
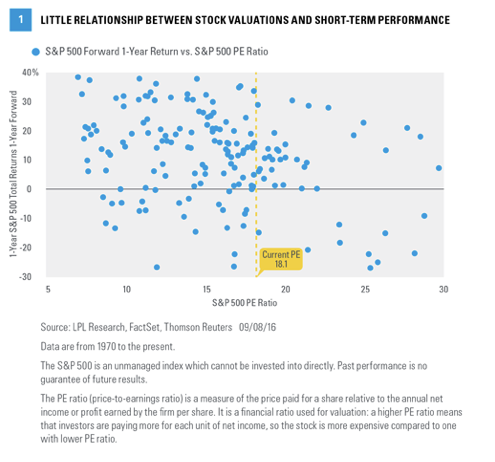
Valuations were a reason to sell during the tech bubble, but it was hard to tell when. The one-year return for the S&P 500 from March 31, 2000, at a PE of 28.2, was -21.7%. But valuations were high well before that, suggesting that even at extremes, predicting market direction using valuations is an inexact science at best. Starting in June 1997, with the S&P 500’s PE over 20, the S&P 500 produced gains of 30.2% and 22.8% over the two subsequent 12-month periods.
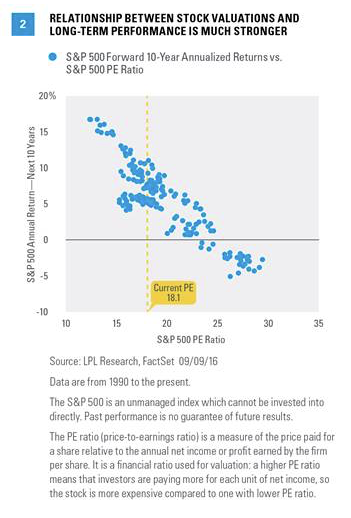
The relationship between stock market performance and valuation gets much stronger when looking at longer time periods. As shown in Figure 2, when plotting PE against stock returns over the subsequent 10-year period, the correlation (negative) is quite strong. As PEs rise, subsequent returns are lower; and vice versa. Eyeballing the two charts it is easy to see the difference, but we can put numbers on it. The correlation between PE and returns over the next 10 years is -0.87, a much closer relationship than PEs and one-year returns at -0.31 (-1 is perfect negative correlation and 0 equates to no correlation).
DOES THE CALENDAR SAY SELL?
What about September being a historically weak month? Could Friday’s drop be the start of a big September sell-off? The market trend appears to be a key determinant of the market’s performance in September and for the rest of the year. We can measure the market’s trend based on the S&P 500 level compared with its 200-day moving average. When stocks are in an uptrend, i.e., above the 200-day moving average, heading into September, they usually hold up well. In fact, the last 47 instances when the S&P 500 was above the 200-day moving average on September 1 (back to 1950), the average maximum drawdown in September was just 1.9%, the maximum drawdown over the rest of the year was a manageable 4.4%, and stocks were higher from September through year-end 83% of the time [Figure 3].
Conversely, nearly all of the biggest late-year drops took place during the 19 instances when the S&P 500 started September in a downtrend, i.e., below its 200-day moving average (1987 was one big exception, falling as much as 32%). The average drawdown in these scenarios was 8.9%, about twice the average drawdown with the uptrend, while stocks were higher over the rest of the year only 57.9% of the time.

MORE REASONS TO HOLD ON
Valuations and the calendar may not be good reasons to sell, but are there, in fact, reasons to consider buying here? We have held our 2016 stock market forecast unchanged (mid-single-digit returns for the S&P 500 for the year), but a double-digit return year for stocks would not shock us, given these factors:
· Low recession odds. We continue to see the odds of recession over the next 12–18 months as being in the 20% range based on our favorite leading indicators and few signs of excesses in the economy that might lead to major imbalances. If a recession is more than a year away, based on data back to 1950, the odds are over 80% that the S&P 500 delivers a positive annual return.
· Central bank support and low interest rates. If the economy weakens further, the Federal Reserve (Fed) may deliver additional stimulus. The Fed could state its intentions to maintain low interest rates for longer, or potentially initiate another round of quantitative easing, i.e., more bond purchases. We do not like relying on these policies to prop up stocks, but the fact remains that markets have responded to them. Low bond yields continue to enhance the appeal of stocks.
· Earnings rebound. Future earnings estimates have tended to run high historically and are always subject to change; however, the economic data, along with stability in oil and the U.S. dollar, suggest an earnings rebound may be doable. Current earnings growth expectations based on Thomson Reuters consensus data for the fourth quarter of 2016 and first and second quarters of 2017 are +8%, +15%, and +13%. Remember, markets tend to look about six months ahead.
· Fourth quarter rally? The S&P 500 has historically performed well during the fourth quarter with an average gain of over 4% (versus a 2.1% average for all quarters), with gains 79% of the time going back to 1950. Fourth quarters of election years are no better than an average quarter, but excluding 2008, the average fourth quarter gain during an election year is 3.6% and the S&P 500 is higher 87% of those quarters. We continue to believe that markets should welcome greater clarity on the potential election outcome when it arrives.
CONCLUSION
Neither valuations nor seasonality appear to be good reasons to sell stocks right now. In fact, a number of factors we have discussed here suggest stocks could potentially go higher between now and year-end. We are sticking with our mid-single-digit return forecast for 2016, but don’t be surprised to see a pickup in volatility and consider the opportunity to buy those dips.*
Burt White is chief investment officer for LPL Financial.