Academic research proves that smart beta strategies can work, but not all of them work the same.
As the universe of smart beta products continues to expand, the performance of different single- and multi-factor strategies has diverged radically, so radically that it is impossible to know which strategy will work best at any given time, according to a recent analysis from the Schwab Center for Financial Research.
“It’s important for advisors and investors to understand the differences between the strategies,” says Anthony Davidow, vice president, alternative beta and asset allocation at the Schwab Center for Financial Research. “This is a reminder of the cyclicality of factors.”
Furthermore, investors may look at performance on too short a timeline to reveal the positive impact of smart beta strategies, said Davidow.
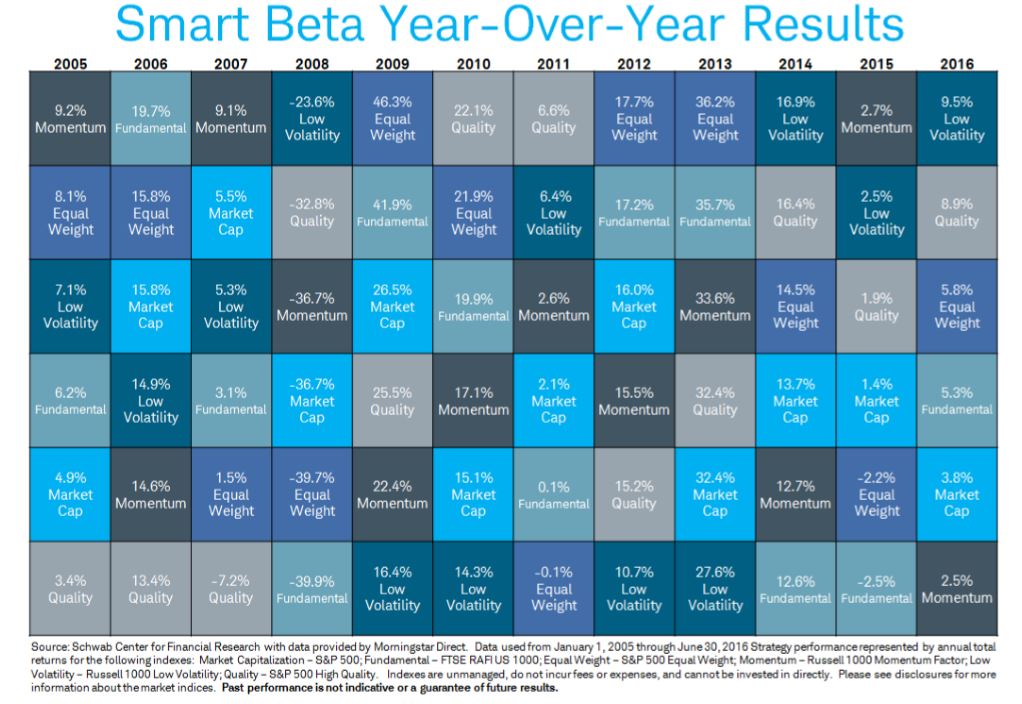
Schwab’s analysis breaks down six different smart beta index factors and strategies and arranges them in a “quilt chart” by their annual performance over the 11-year period from 2005 to 2015, and also their performance through the first half of 2016.
The analysis uses three factors: momentum, low volatility and quality; and three weighting strategies: market-cap, equal weighting and fundamental indexing.
Smart beta factors and strategies appear to rotate with no discernable pattern, says Davidow. The chart doesn’t show a clear winner or loser between smart beta strategies and factors.
“We don’t ascribe any predictability to any of this,” Davidow says. “What’s interesting is that you can see how strategies might compliment each other within a portfolio or a multi-factor product. Fundamental indexing and market-cap weighting serve as a compliment to each other. If someone were to suggest that fundamental indexing and momentum also complimented each other, I would tend to agree.”
The analysis also shows that the ascendance of any one factor appears to be short-lived, at best.
For example, the momentum factor strategy performed best in 2015, offering investors a 2.7 percent return, beating the market-cap weighted S&P 500 by 130 basis points. Through the first half of 2016, however, momentum was the worst-performing strategy in Schwab’s analysis as it posted a 2.5 percent return, lagging the market-cap weighted S&P 500 by 130 basis points.
“Intuitively, if you believe in mean reversion, you should anticipate that at some point these are going to be lagging strategies,” Davidow says.
Low volatility, a recent high performer, was ironically among the most volatile factors by performance, offering the best returns in the analysis in 2008, 2014 and the first half of 2016, but the worst returns in 2009, 2010, 2012 and 2013.
Overall, the best smart beta performances were posted by the equal weighting strategy, which returned 46.3 percent in 2009 and 36.2 percent in 2013, both years where equities performed well in general.
The worst performances were posted by fundamental indexing in 2008, where it posted a -39.9 percent return amidst the global financial crisis, and by the quality factor, which posted a -7.2 percent return in 2007.
Also interesting is that on an annualized basis, a market capitalization-weighted index often ends up outperforming two or more smart beta strategies.
“All of these strategies claim to outperform their market-cap equivalents, and on a long enough timeline they do,” Davidow says. “When you compare them in a given year, however, they don’t necessarily deliver on that promise. It’s important for advisors and investors to keep that in mind.”