Whether you are looking for a starter home, a family home, an empty nester home or a forever home, you want real estate that is both stable and affordable, according to SmartAsset.
A healthy home market is one where it is just as easy to sell your home as it was to buy it, with a low risk of losing money over the long run, says SmartAsset in a report that ranks the nation's best home markets.
A healthy market, the website said, is characterized by four indicators: stability, risk, ease of sale and affordability.
Affordability accounted for 40% of SmartAsset’s Healthiest Markets Index, while each of the three other factors accounted for 20% each. In cases where data on the above four factors was unavailable for a city, SmartAsset excluded it from its rankings of the healthiest home markets.
Nationwide, homeowners live in their homes an average of 15.5 years. An average of 13.1% of them have negative equity, but 35.8% of homes decrease in value, according to SmartAsset. Homes nationwide cost their owners an average of 21.8% of their income, and are on the market an average of 166.1 days.
The following cities, in ascending order, are SmartAsset’s top 10 easiest places to sell a home:
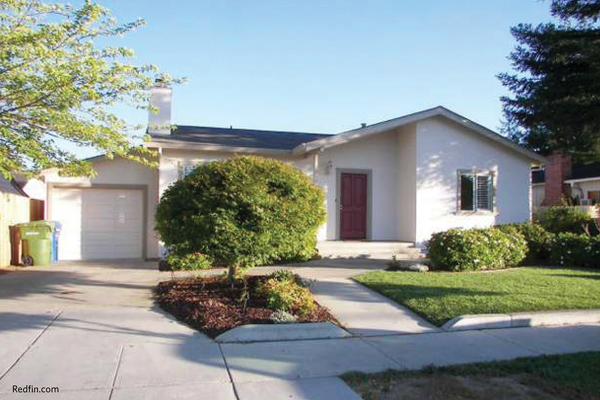
10. Westmont, Calif.
Suburban Westmont is located in Los Angeles County. Residents live an average of 13.4 years in their homes. No homes have negative equity and only 1.7% decrease in value. Homes cost 26.8% of income and are on the market for an average of 18.9 days.
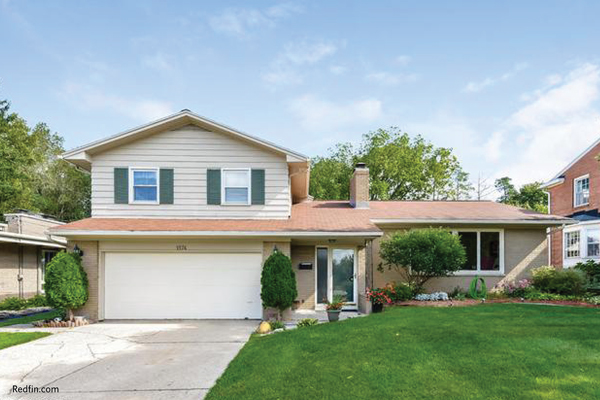
9. Grand Rapids, Mich.
Grand Rapids is Michigan’s second-largest city. Residents live an average of 12.2 years in their homes. An average of 6.6% of homes have negative equity and only 6.5% decrease in value. Homes cost 19.4% of income and are on the market for an average of 18.9 days.
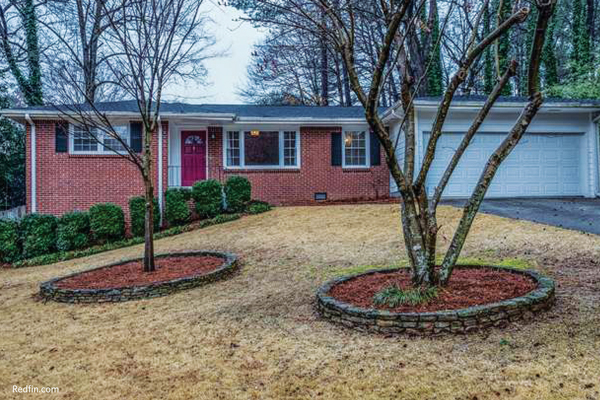
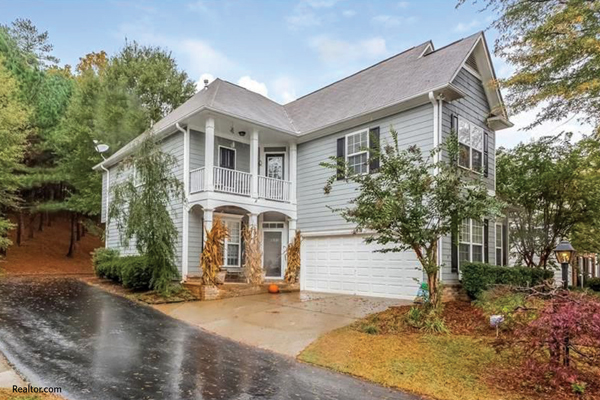
8. Chamblee, Ga.
Chamblee is located just 14 miles from downtown Atlanta. Residents live an average of 9.7 years in their homes. While an average of just 9.1% of them have negative equity, 22.1% decrease in value. Homes are on the market an average of 18.8 days and cost 20.8% of homeowners’ income.
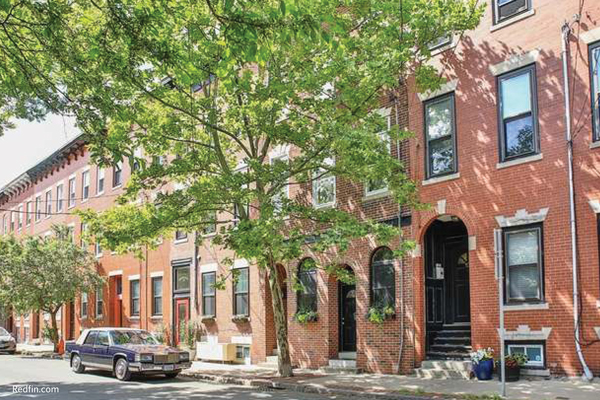
7. Chelsea, Mass.
Chelsea is a Boston suburb where residents live an average of 10.5 years in their homes. An average of 14.9% of homes have negative equity, but only 5% of them decrease in value. Homes cost 24.8% of owners’ income and are on the market an average of 17.2 days.
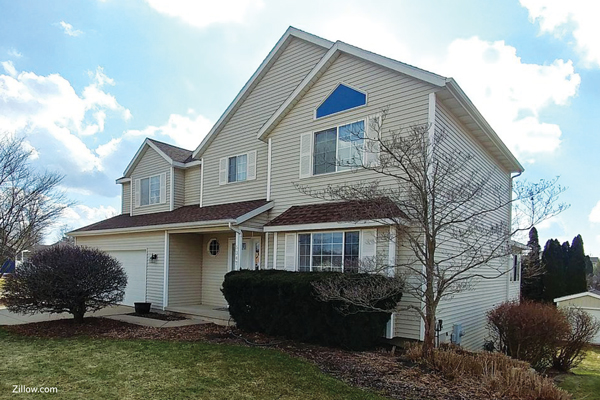
6. Wyoming, Mich.
Wyoming is the largest suburb of Grand Rapids. Residents live an average of 13.1 years in their homes. An average of 5.6% of homes have negative equity and just 4% of them decrease in value. Homes cost 19.2% of owners’ income and are on the market an average of 16.2 days.
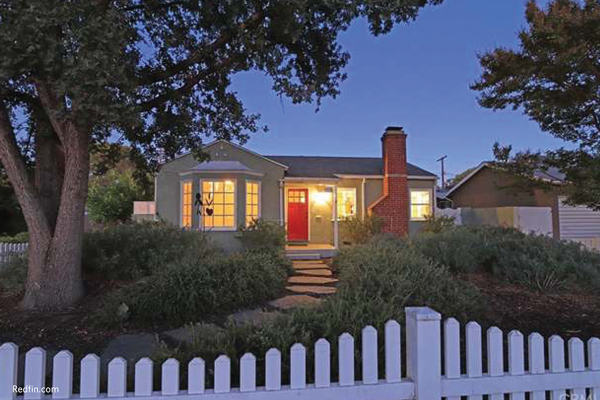
5. Burbank, Calif.
Burbank is a 10-minute hike from the world famous Hollywood sign. Residents live an average of 12.7 years in their homes. An average of 4.7% of homes have negative equity and an average of 8.6% decrease in value. Homes cost 23.5% of their owners’ income and are on the market an average of 15.1 days.
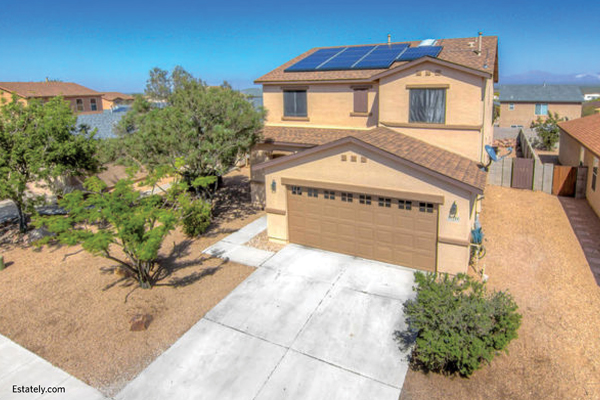
4. Sahuarita, Ariz.
Sahuarita has colleges for the young and retirement communities for the young at heart. Residents live an average of 8.6 years in their homes. While an average of 20.1% of homes have negative equity, an average of just 6.4% decrease in value. Homes cost 20.3% of owners’ income and are on the market an average of 12.3 days.
3. Scottdale, Ga.
Residents live an average of 10.5 years in their homes. An average of 21.5% of homes have negative equity, but none decrease in value. Homes cost 20.5% of owners’ income and are on the market an average of 11.6 days.
2. Pella, Iowa
Known as the Garden City, Pella is famous for Tulip Time, its annual spring tulip festival. Residents live an average of 12.3 years in their homes. An average of 9.7% of homes have negative equity and 40.3% decrease in value. Homes cost 18.6% of owners’ income and are on the market an average of 8.1 days.
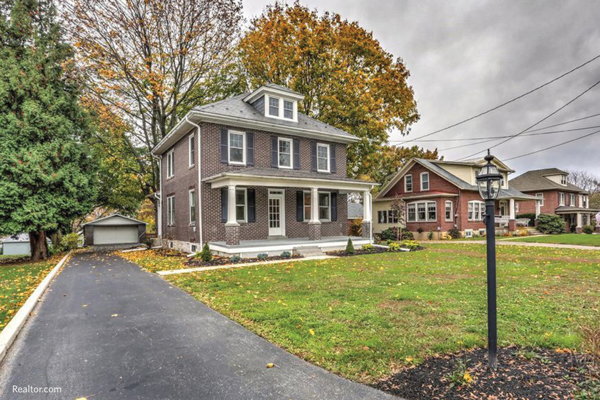
1. Lancaster, Pa.
Lancaster is home to the Pennsylvania Amish farm community. Residents live an average of 11.4 years in their homes. An average of 8% of homes have negative equity and an average of 16.3% decrease in value. Homes cost an average of 20.9% of owners’ average income and are on the market an average of five days.
The full report can be viewed here.