


Investors cheered the two better-than-expected inflation reports last week, pushing the S&P 500 to 16% above its June 16 low and only 11% below its all-time high. After this rebound, the key question investors are asking is whether this is a bear market rally that will soon fizzle or the start of a new bull market. There’s too much uncertainty to have a high conviction view right now, but we do believe the odds have risen that a new bull market has begun.
Encouraging Signs
The news on the economy and corporate profits hasn’t been great lately, but thanks to low expectations, it’s been good enough to push stocks nicely higher. Sentiment had gotten so negative and major indexes so oversold that any developments on the good side of those low expectations had the ability to push stocks higher.
Now that better news is priced into stocks with the S&P 500 price-to-earnings ratio approaching 18, the next leg higher may be tough. That move will likely depend on the market gaining more confidence that the inflation battle will be won, setting the economy up for a soft landing as the Federal Reserve (Fed) slows its pace of rate hikes.
Technical Signals
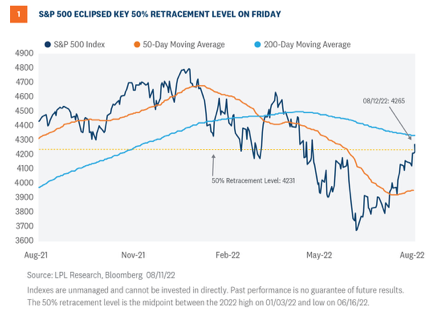
To better assess whether a new bull market has begun, we can look at some technical analysis signals that have historically been effective in identifying major market reversals. One is the 50% retracement level. The S&P 500 Index flirted with that level of 4,231 on August 11 but ultimately closed above it on Friday as shown in Figure 1. In all bear markets since WWII, when the index has risen above that retracement level, it has been the start the next bull market rather than a bear market rally which eventually fell to new lows (thanks to our friend Sam Stovall at CFRA for this great insight).
Surging Breath
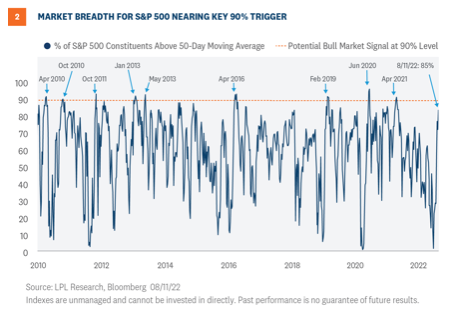
Another technical analysis signal that may end up accurately sounding the all-clear is the percentage of S&P 500 stocks trading above their 50-day moving averages. As shown in Figure 2, the 90% level has historically signaled the start of new bull markets coming off of major lows such as 2009, 2011, 2018-2019, and 2020. This indicator reached 87% on August 11, very close to that 90% trigger. While this is not a necessary condition for the end of the bear market, it would increase our confidence that a rally back to the old highs will come before a return to the June lows.
A Case That The Bottom Is In
We can also look at some of these and other technical readings during historical early-stage bull markets. With the help of our friend Ed Clissold at Ned Davis Research, we have included three technical indicators, as well as the maximum levels they reached in the first 30 days of each of the past 11 bull markets, to compare them to today’s market.
As you can see in Figure 3, the percent of stocks at new 21-day highs near 53% is well above the average (43%) during these other young bulls.
Similarly, at over 25%, the percent of stocks at new 63-day highs is well above the 16.7% average for these other young bulls.