I’m in my late 50s and I’m on the job. So are more than 70% of Americans aged 55 through 59, according to the Bureau of Labor Statistics. In fact, my age group’s labor-force participation rate was approaching record levels earlier this year before undergoing its usual summer decline.
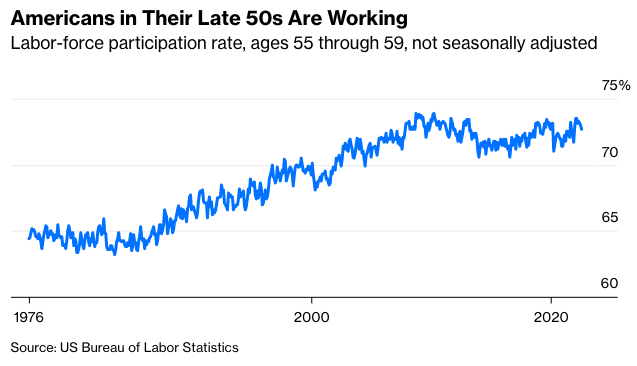
As a result, I tend to bristle a little whenever I read about the big drop in labor-force participation among Americans 55 and older and its supposed adverse effects on the labor market and the economy. It is true that, as of August, the labor-force participation rate for the entire 55-plus age group was, at a seasonally adjusted 38.6%, down 1.7 percentage points from just before the pandemic in February 2020 and near its lowest level in 15 years. But as I’ve already demonstrated, those of us in our late 50s aren’t the problem. We’re still working at record rates!
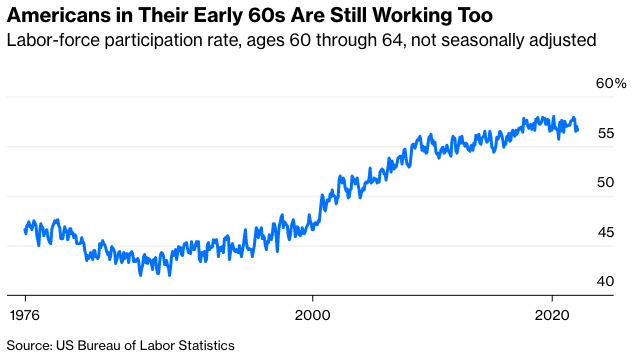
Americans in their early 60s are pretty close to record labor-force participation, too. The big declines are all among those 65 and older. But—and here’s where things get really weird—those declines are still smaller in percentage-point terms than those for the 55-and-older group overall. This strange data quirk is the result of so-called composition effects, caused by the shifting age distribution within the age group, which I’ll discuss a little later. First, though, let’s get around the strange quirk by looking at labor market changes for smaller age groups.
The reason the 55-and-older numbers get so much attention is that it’s the one of the few age groups for which the BLS provides seasonally adjusted labor market data. The unadjusted numbers come with big seasonal swings and, especially when you’re looking at narrow age groups such as 55 through 59, a fair amount of month-to-month statistical noise. Still, there are ways to deal with both, such as comparing three-month averages from this summer with those from before the pandemic in 2019.
The labor-force participation rate is the estimated number of Americans who have paid jobs (not counting active-duty military) or are looking for work, divided by the civilian, non-institutionalized working-age population. Another key metric, the employment-population ratio, is those with paid jobs divided by population, also excluding active-duty military and the institutionalized. Both are expressed as percentages, so why one is called a rate and the other a ratio is a mystery to me. After this chart I’ll just refer to both as rates.
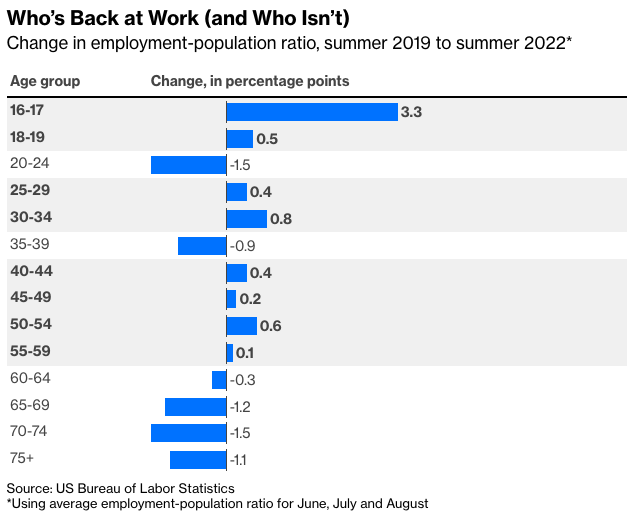
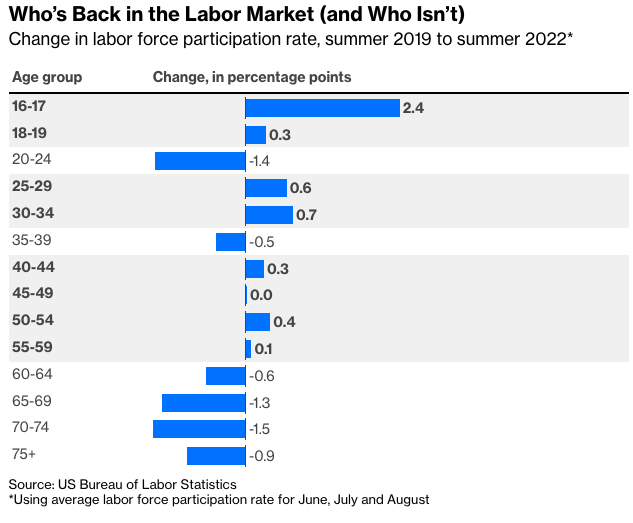
One thing that stands out here is the apparently limited labor market impact of Long Covid. Lingering effects of Covid-19 are real, and may afflict millions of Americans, but the fact that every under-60 age group but two has higher labor-force participation and employment rates than before the pandemic seems to indicate that Long Covid isn’t keeping significant numbers of working-age Americans out of the workforce.
As for the two under-60 age groups that haven’t returned to or surpassed their summer 2019 participation and employment rates, those in their early 20s may be staying in college longer to make up for pandemic gap years and other delays, or still struggling to recover from the many disruptions to the job market and society in general in 2020. For those in their late 30s child-care complications could be a culprit, although curiously, women in that age group are back to pre-pandemic levels while men are not.
For workers 60 and older, who in the decades before the pandemic had been experiencing steady gains in labor-force participation and employment, it makes sense that a disease that was far deadlier for the elderly drove many out of the labor force—because of either fear of catching Covid-19 or struggles with Long-Covid complications after catching it. The remarkable performance of stocks and other assets in 2020 and 2021 may also have led some affluent older workers to retire earlier than planned.
But again, members of the 60-to-64 age group left only briefly. Their labor-force participation rate hit an all-time high in March 2020, when low response rates amid lockdowns may have skewed the data, and came close to that again last November. (“All-time” for these numbers only goes back to June 1976, but statistics available back to 1948 for the broader 55-to-64 age group indicate that recent rates are the highest over that period too.)
Participation among those 60 through 64 was down this summer relative to summer 2019, but that could be evidence of changing seasonal hiring patterns rather than a sustained decline in labor-force attachment. Teenage labor-force participation collapsed in the 2000s, leading traditional teen employers such as McDonald’s to recruit senior citizens for summer jobs. Now hordes of 16-and-17-year-olds are entering the labor force, reducing the need for such efforts.
Those 65 and older have in fact seen a clear drop in labor-force participation after decades of gains. But 65-plussers made up only 6.6% of the labor force in August, compared with the 16.4% share accounted for by those 55 through 64. Their 1.1 percentage point labor-force participation decline since summer 2019 works out to 626,835 missing would-be workers — not nothing, but also not that huge a deal in a labor force of almost 165 million.
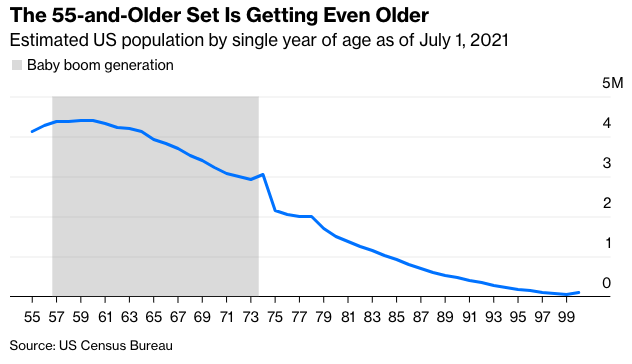
The labor-force participation decline for the broad 55-and-older category is 1.7 percentage points whether measured in seasonally adjusted data from February 2020 or in unadjusted summer-2019-to-summer-2022 comparisons, as I did with the other age groups. How can this be bigger than the decline for those 65 and older, not to mention those in their late 50s and early 60s? Well, the youngest baby boomers are turning 58 this year, meaning that the younger end of the 55-and-older group is now being replenished with the less-numerous members of Generation X.
Because of this, the average age of Americans in the 55 and older category rose even through the ravages of Covid-19 and will continue doing so. (It fell in the Census Bureau’s data from mid-2019 to April 2020 because the 2020 Census found that there were fewer 70-and-older Americans than the bureau had previously estimated, but that's another story.) Meanwhile, labor-force participation tends to peak around age 40, and decline as people age beyond that. So with each passing year, the 55-plus labor-force participation rate will drop even if the rates for every year of age within the group remain the same. The reverse transpired as the baby boomers began to enter the age group two decades ago, as will also be the case for the 75-plus age group that they started joining last year.
The aging of the baby boomers and the U.S. population in general is real and will have a lot of economic consequences, but the seeming mass exodus of 55-and-older workers during the pandemic is to some extent a statistical mirage. That is, many older Americans did leave the workforce, but the irreversible process of aging was as much to blame as the possibly reversible consequences of the pandemic. Those looking to bring more people into the labor market should probably focus on solving the problems that are keeping away would-be workers in their early 20s and late 30s rather than worrying about the oldsters.
Then again, there is another composition effect at work in these statistics that I haven’t discussed. While women’s labor-force participation rates rose from the 1950s through 1990s, men’s fell. So while the current labor-force participation rate for all Americans in their late 50s and early 60s is near an all-time high, for men it’s well below the rates that prevailed before the mid-1970s.

The puzzle of why labor-force participation fell so much among U.S. men of all ages was a major topic of economic discussion in the 2010s that’s probably due for a revival. For those in their late 50s and early 60s the decline wasn’t all bad news, as generous early retirement packages surely drove some of it. Those are less common than they used to be, while boosting male 55-64 labor force participation back to, say, the August 1970 rate of 82.6% would add 2 million would-be workers to the U.S. job market. Bringing the participation rate for so-called prime-age men (25-54) back to 1970 levels would add another 4.5 million. Reversing changes that happened half a century ago is surely a lot harder than reversing those of the past couple of years. But maybe it’s the next frontier.
Justin Fox is a Bloomberg Opinion columnist covering business. A former editorial director of Harvard Business Review, he has written for Time, Fortune and American Banker. He is author of The Myth of the Rational Market.