


The US stock market today is characterized by a seemingly unusual combination of very high valuations, following a period of strong earnings growth, and very low volatility. What do these ostensibly conflicting messages imply about the likelihood that the United States is headed toward a bear market?
Moritz Hager / Wikimedia
To answer that question, we must look to past bear markets. And that requires us to define precisely what a bear market entails. The media nowadays delineate a “classic” or “traditional” bear market as a 20% decline in stock prices.
That definition does not appear in any media outlet before the 1990s, and there has been no indication of who established it. It may be rooted in the experience of October 19, 1987, when the stock market dropped by just over 20% in a single day. Attempts to tie the term to the “Black Monday” story may have resulted in the 20% definition, which journalists and editors probably simply copied from one another.
In any case, that 20% figure is now widely accepted as an indicator of a bear market. Where there seems to be less overt consensus is on the time period for that decline. Indeed, those past newspaper reports often didn’t mention any time period at all in their definitions of a bear market. Journalists writing on the subject apparently did not think it necessary to be precise.
In assessing America’s past experience with bear markets, I used that traditional 20% figure, and added my own timing rubric. The peak before a bear market, per my definition, was the most recent 12-month high, and there should be some month in the subsequent year that is 20% lower. Whenever there was a contiguous sequence of peak months, I took the last one.
Referring to my compilation of monthly S&P Composite and related data, I found that there have been just 13 bear markets in the US since 1871. The peak months before the bear markets occurred in 1892, 1895, 1902, 1906, 1916, 1929, 1934, 1937, 1946, 1961, 1987, 2000, and 2007. A couple of notorious stock-market collapses – in 1968-70 and in 1973-74 – are not on the list, because they were more protracted and gradual.
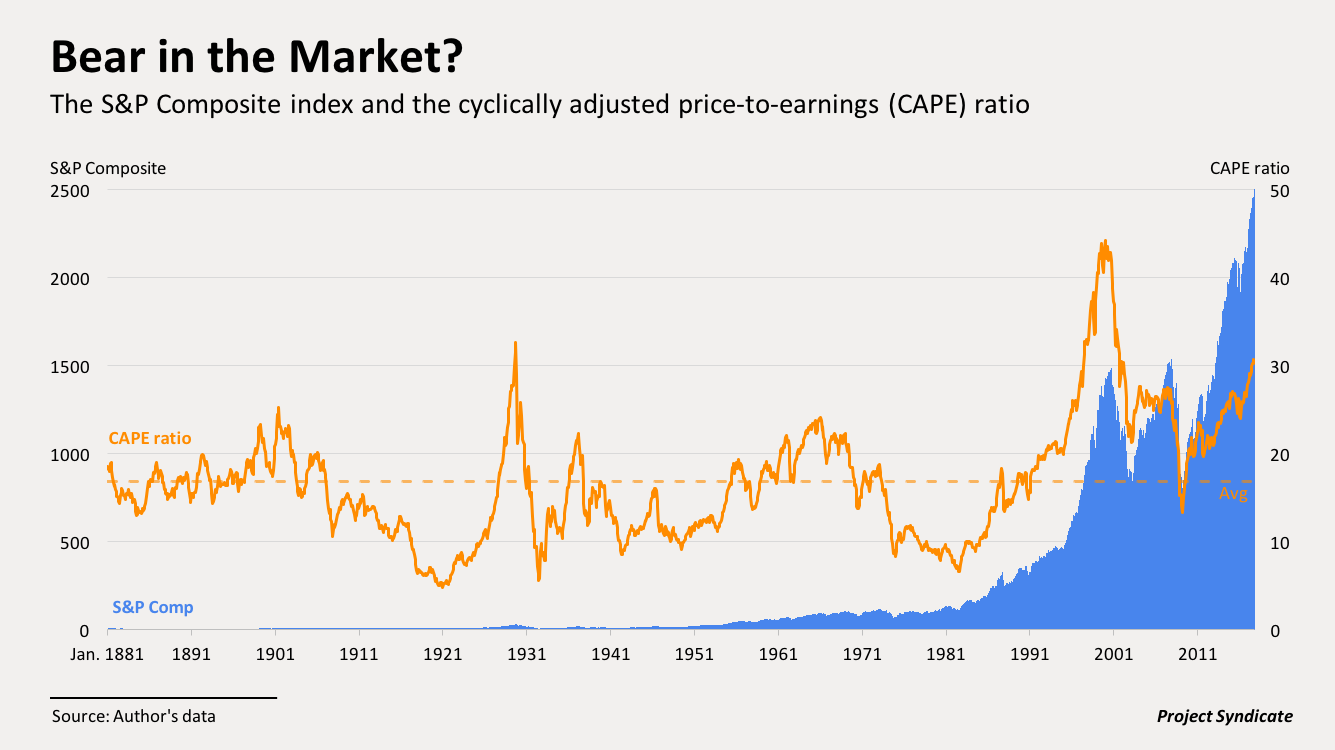
Once the past bear markets were identified, it was time to assess stock valuations prior to them, using an indicator that my Harvard colleague John Y. Campbell and I developed in 1988 to predict long-term stock-market returns. The cyclically adjusted price-to-earnings (CAPE) ratio is found by dividing the real (inflation-adjusted) stock index by the average of ten years of earnings, with higher-than-average ratios implying lower-than-average returns. Our research showed that the CAPE ratio is somewhat effective at predicting real returns over a ten-year period, though we did not report how well that ratio predicts bear markets.
The Coming Bear Market?
September 21, 2017
« Previous Article
| Next Article »
Login in order to post a comment