How fast the economy is growing at any given point in time is important to know. Citizens, policymakers, investors, central banks, and, in election years, politicians, all want to know how we’re doing. These days, they want to know instantly. The problem is, getting a good read on how fast an economy is growing, in real time, is difficult at best. Trying to ascertain how the sectors of an economy (manufacturing, consumer, business spending, construction, etc.) are performing is even more difficult. Yet, despite all the issues, every day, week, month, or quarter, we obsess over the economic data and the pace and composition of growth in the U.S. (and global) economy.
Timeliness vs. Accuracy
Those responsible for collecting and disseminating economic data face the constant trade-off between timeliness of the data and the ultimate accuracy in capturing the economic phenomenon the data are trying to measure. Many nations (both developed and emerging) worldwide have robust processes in place to gather and report economic data on a timely basis. But generally speaking, the U.S. has the most reliable, comprehensive, timely, and conflict-free economic data collection and reporting system in the world. Despite our leading position on collection and distribution, the economic data digested on an hourly, daily, weekly, monthly, and quarterly basis are still subject to a great deal of uncertainty and revision.
While it’s true that gross domestic product (GDP) is the most comprehensive look at the health of a nation’s economy, it is not very timely, and it is subject to substantial revision over time. In addition to those “faults” in recent years, a gap has opened up in the quarterly pattern of GDP growth and appears to have widened substantially, making the data even more difficult to interpret, especially in the first two quarters of the year.
The U.S. Bureau of Economic Analysis (BEA) released its latest estimate of the nation’s first quarter 2016 GDP last Friday, May 27, 2016. The initial take on first quarter 2016 GDP growth, at just 0.5%, was released in late April 2016. Based on the new and revised input data (construction, factory shipments, retail sales, etc.) released since late April 2016, first quarter GDP was revised up to 0.8%.
Seasonal Adjustment And GDP
GDP is reported by the BEA in several different ways, but the most commonly cited way is on a “real” (inflation-adjusted) seasonally adjusted annualized basis. GDP is seasonally adjusted to smooth out the fluctuation in the economy related to weather patterns, shopping patterns, holidays, school vacations, and other factors, to allow apples-to-apples comparisons between quarters. For example, vehicle assembly plants typically shut down in July, which would depress GDP in the third quarter (July, August, and September) relative to the second quarter (April, May, and June). Similarly, jewelry sales spike around Christmas and again at Valentine’s Day. Seasonally adjusting the data helps market participants to see through the swings in the seasonal data and may better reveal the true underlying health of the economy at any time of the year.
All else being equal, over long periods (40 or 50 years), annualized GDP growth across all four quarters in a year should be roughly similar, and differences in growth rates between quarters should also be minimal and stable. In recent years, however, there has been a widening gap between GDP growth in the first quarter and the second quarter that did not exist in the 45–50 years between 1950 and 1995; as a result, market participants have begun to question how well the statisticians and economists at the BEA are making these adjustments.
The First Quarter GDP Gap
Figure 1 shows the quarter-to-quarter annualized growth rates in seasonally adjusted real GDP in each quarter for different time periods. For example, in the 46 first quarters from 1950 through 1995, real GDP growth averaged 4.3%. GDP growth averaged 3.9% in second quarters, 3.7% in third quarters, and 3.0% in fourth quarters. In general, from 1950 through the mid-1990s, there was not much difference in quarterly growth rates, which suggests that the seasonal adjustment process for GDP was relatively effective at smoothing out the quarter-to-quarter blips in the economy due to weather, purchasing patterns, shifts in holidays, the timing of school holidays, and auto plant shutdowns. During those 46 years, the first quarter was the weakest quarter of growth 13 times, or 28% of the time, which is about what you would expect.
But what about the difference between growth in the first and second quarter? This is at the center of attention this week after the tepid reading on first quarter GDP (+0.8%) versus a consensus estimate for second quarter GDP tracking at between 2.5% and 3.0%, based on the economic data in hand for April and May. From 1950 through 1995, growth in the first quarter averaged 4.3% and growth in the second quarter averaged 3.9%, a difference of just 0.4%. Indeed, in 24 of those 46 years (52% of the time) growth in the first quarter was faster than in the second quarter, but that has changed over the past 20—and especially the past 10—years.
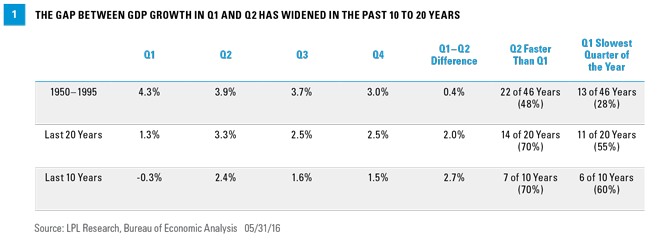
Since 1995, first quarter GDP growth has averaged 1.3%, and, on average, is the quarter with the slowest growth; it has been worst performing quarter of the year in 11 years, more than half the time. Again, if seasonal adjustment was working, this should not be the case over a 20-year period; quarterly variations should be more randomly distributed throughout the year. Over that same time, GDP growth in second quarters has averaged 3.3%, a full 2 percentage points higher than growth in first quarters. In 14 of the past 20 years (70% of the time), GDP growth in the second quarter has been faster than in the first.
Over the past 10 years, this GDP gap has widened even more. Reported GDP growth in the first quarter between 2007 and 2016 has been -0.3%. Although this figure is clearly skewed lower by the 5.4% drop in real GDP in the first quarter of 2009, it is well below the average gain in second quarters over this period (2.4%); also, the 2.7% gap between growth in the first and second quarter is nearly seven times as wide as it was between 1950 and 1995. GDP growth in the first quarter has been the slowest quarter of growth in 6 of the past 10 years, again, not what you would expect if the seasonal adjustment process was working.
Academics and government statisticians have written many papers on why this is happening, but we’d do them a disservice by trying to recap them here. A year ago, in May 2015, the BEA acknowledged this gap, calling it “residual seasonality” and said it would attempt to adjust for it in the future; although more than a year later, the “gap” between first quarter and second quarter GDP still exists.
What Does The seasonal GDP Gap Mean For The Fed?
Why do markets care about this quirk? The market and Federal Reserve (Fed) policymakers are well aware of the first quarter GDP gap and will likely look at average GDP growth in the first and second quarter to get a better gauge of the economy. The GDP data for the second quarter of 2016 are not due out until July 29, so Fed policymakers won’t have that data in hand when they meet on June 14–15 or July 26–27. If second quarter GDP accelerates to 3%, GDP growth in the second quarter would be faster than the first for the seventh time in the past 11 years.
In addition, should it land at around 2% for the first half of the year (first and second quarters), real GDP would be growing faster than potential GDP, taking up slack and slowly pushing up wages/inflation. (See our Weekly Economic Commentary, “Building Blocks.”) Potential GDP is the “maximum” growth rate for an economy, based on labor force growth and productivity, and due to stagnant productivity and slow growth in the labor force, potential GDP is running at just under 2.0%. Even with the economy growing at around 2.0%, the Fed is already on pace to do two interest rate hikes this year. If growth accelerates into the 2.5–3.0% range in the second half of 2016, the Fed could be considering a third rate hike later this year.
John Canally is chief economic strategist for LPL Financial.