


“Beware an inverted yield curve!”
Those five words, declared by an otherwise mild-mannered college economics professor, were forever seared into my mind and have stuck with me all these years. Not only was the professor’s advice sage, it was also very timely. I was in this particular economics course at a time when the yield curve was flattening, eventually to become inverted ahead of the Great Recession. That got me thinking—what would happen when the yield curve inverts again?
A yield curve inversion, as measured by the difference between the 2-year U.S. Treasury and the 10-year U.S. Treasury, first inverted ahead of the Great Recession on December 27, 2005, according to the Federal Reserve Bank of St. Louis. At that time, the S&P 500 was trading at 1,248. It wasn’t until 651 days later on October 8, 2007 that the S&P 500 peaked, hitting a high of 1,561 before dramatically tumbling and starting the Great Recession. Despite the professor’s timely warning, the market was 25 percent higher on a price basis than when the yield curve first inverted.
The financial losses endured by so many due to the Great Recession still linger in the collective consciousness of the financial services industry. As a means of helping forecast future market decline, many experts have been focusing on the yield curve to predict a potential downturn in the markets. Looking back at the last 41 years, an inverted yield curve has indeed preceded all five recessions.
The blue line in the following chart measures the difference between the yields on the 2-year and 10-year Treasury. When said line crosses below the black centerline, it signifies the 2-year Treasury yield is now higher than the 10-year Treasury yield. In other words, the yield curve has inverted. The red circles highlight the first instance when the yield curve inverted ahead of each of the subsequent recessions indicated by the shaded areas.
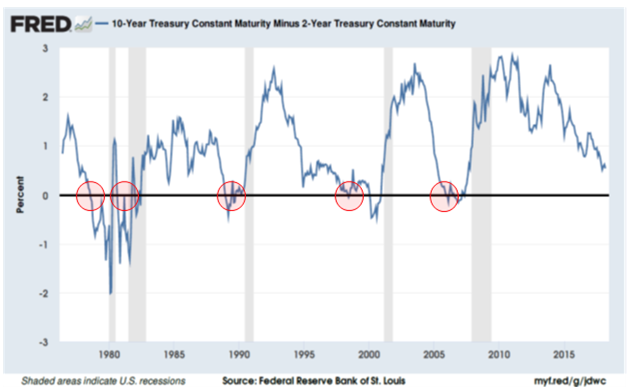
The chart above suggests, therefore, inverted yield curves can be useful in predicting economic recessions. The next question becomes—can it be used to predict a recession-induced bear market? Let’s break it down by recession.
Below is a table showing when the yield curve first inverted, the associated peak in the S&P 500, and the duration of each of the last five recessions:
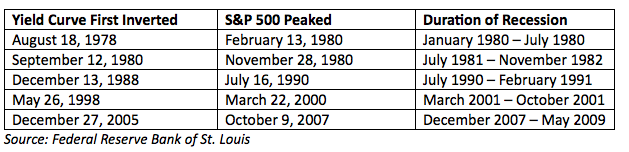
The yield curve inverts on average 614 days, or about 20 months, ahead of a recession. The following table then analyzes when the S&P 500 peaked in relation to the yield curve’s first inversion: