


Last month, when the S&P 500 Total Return Index had recovered half its 2022 losses, I highlighted the historical attractiveness of buying stocks in that circumstance. I did warn that past performance does not indicate future results as well as how stocks are essentially a random walk. Nevertheless, stocks do have some momentum and buying with that tailwind, plus valuations still well below peak, with history on your side, seemed easier than buying stocks at other times.
So, unless the S&P 500 has a strong finish to this week, we will have only the second time since 1873 when buying at the halfway recovery point was a mistake -- and I will get some more angry emails. Let’s see if we can figure out how I went wrong.

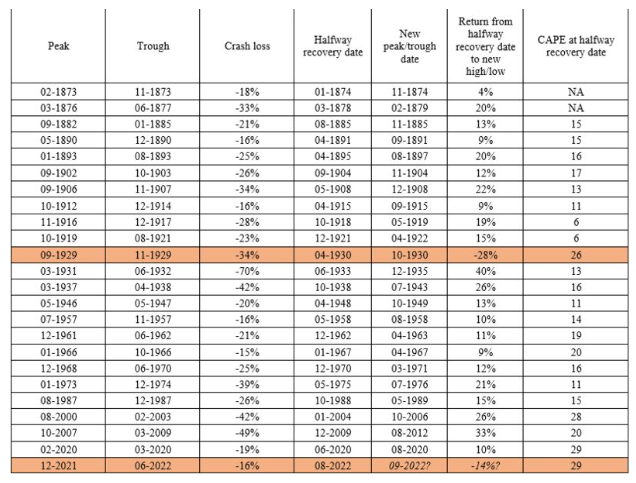
The table below shows all 24 declines in month-end S&P total return indexes of 15% or more since 1871. The halfway point is the first month end after the 15% loss at which the index had recovered half its value. The column titled “New peak/trough date” is the first month end after the halfway recovery date when the index either set a new all-time peak or went below the crash loss point prior to the recovery. The return measures what an investor earned buying stocks at the halfway recovery date and holding until either a new high or new low was set. Only once — buying at the end of April 1930 — did this strategy lose money. On 22 other occasions, S&P 500 total return indexes hit a new all-time high before going below the crash low.
If September 2022 ends at the current S&P 500 value, we will have our second exception in 151 years. So, what’s different about April 1930 and August 2022 from the other 22 times the S&P 500 recovered halfway crashes?
The first word that comes to mind is “value.” Buying at the halfway recovery point is a momentum strategy, one that bets “the trend is your friend.” Momentum strategies are some of the oldest and most reliable tools used by professional traders and quants. But momentum works best when paired with value, which means buying cheap stuff. If you can find stuff that is cheap and also going up in price, you often have an attractive opportunity. Momentum is great on average but can lead you to buy into bubbles or sell into panics. Value is great in the long-run, but the long-run can be very long. When you get value and momentum both, you’re not sure of making money, but it’s about as good a position as an investor can hope for.
The best common measure of stock market value is Yale University professor Robert Shiller’s cyclically adjusted price-earnings ratio, or CAPE. It has averaged 17 since 1871, meaning the S&P 500 has averaged 17 times the average annual inflation-adjusted earnings over any trailing 10-year period (the more usual price-earnings ratio use trailing 12 months of earnings, predicted future earnings or other short-term measures, and therefore bounce up and down with the business cycle). But CAPEs in the 21st century are higher, averaging 26.
The last column in the table shows the CAPE at the halfway recovery date. The first two entries are NA because there aren’t 10 years of earnings history to compute them, but they would likely be around 15 if we had the data. You can see that 20 of the 22 successes occurred when buying at CAPEs of 20 or less. When CAPE was over 20, there was one failure in 1930, two successes in 2004 and 2020, and one probable failure in 2022.
The scary thing is the last time this happened, it took 16 years, the greatest economic depression in history and the biggest war in history to squeeze CAPE back down to 11 and kick off the next cycle of prosperity. I’m not predicting anything like that, of course, but it seems that the market decline in the first half of 2022 was not enough to clear out economic deadwood and deflate bubbles. There may be more pain ahead.
Aaron Brown is a former managing director and head of financial market research at AQR Capital Management. He is author of The Poker Face of Wall Street. He may have a stake in the areas he writes about.
This column was provided by Bloomberg News.