


With the declines yesterday, U.S. markets are now in an official correction. Just to get the terminology straight, a “correction” means a 10-percent decline, while a "bear market" indicates a 20-percent decline. As of the close yesterday, the Dow was down 10.3 percent, and the S&P 500 was down 10.1 percent. The decline really accelerated at the end of the day—bringing the indices into official correction territory.
Of course, putting a name on something doesn’t change it. A drop of 9.9 percent is not that different from one of 10.1 percent, despite the fact that the latter is a correction and the former is not. But now that we are at that point, we need to take another look at whether this could become much worse. I still don’t think this is the big one. I do have to admit, however, that it has come far enough that I am taking a closer look. So, let’s see what that means.
200-Day Moving Average
Historically, one of the better warning signs for larger declines has been when the market breaks what is called the 200-day moving average. This is nothing more than the average of the closing prices for the past 200 days. If the market is above the average, it is in an uptrend; if below, it is in a downtrend.
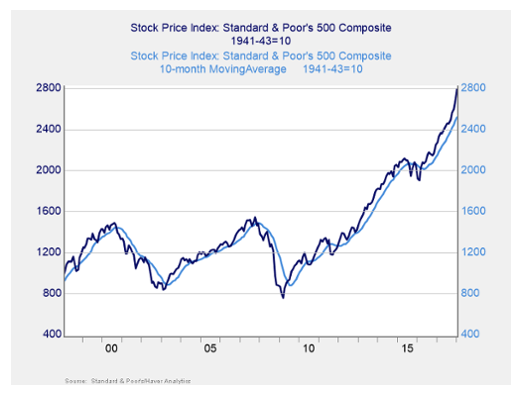
As you can see in the chart above, in both 2000 and 2008 when the S&P 500 broke the 200-day moving average (shown here as 10 months, which equates to 200 trading days), larger declines followed soon thereafter. This is why I start to pay attention when the market breaks below that line.