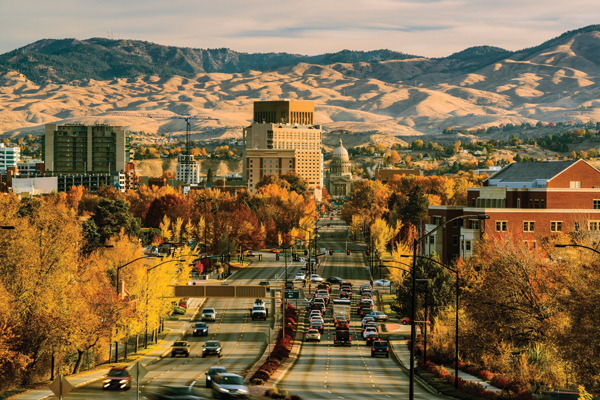
Migration from crowded and expensive Pacific Coast cities has propelled a city in Idaho onto the list of top 10 gainers in the Bloomberg rich versus poor gap ranking of metropolitan areas from close to the bottom.
The analysis of Census Bureau data tracks the differences in annual income between household income groups. The rich versus poor gap compared households in the top 20 percent to those in the bottom 20 percent by metropolitan area.
Nationally, the rich versus poor gap expanded by $31,000 to just over $197,000. Last year’s measure, using data from 2010 to 2015, showed an increase of $29,500 to $189,600.
The Bloomberg ranking also shows the change in the gap between the super rich to middle class which widened in 98 of 100 metropolitan areas, led by Bridgeport, Connecticut, which overlaps entirely with Fairfield County. The gap narrowed in Ogden, Utah and Colorado Springs, Colorado. The super rich to middle class gap is defined by those in the top five percent of income vs households in the middle 20 percent.
A third take of data shows the middle class income span -- defined as the gap between those within 30 and 80 percent of an areas income. The middle class span grew the most in San Francisco where it rose to $140,800 in 2016 from $108,300 five years earlier.
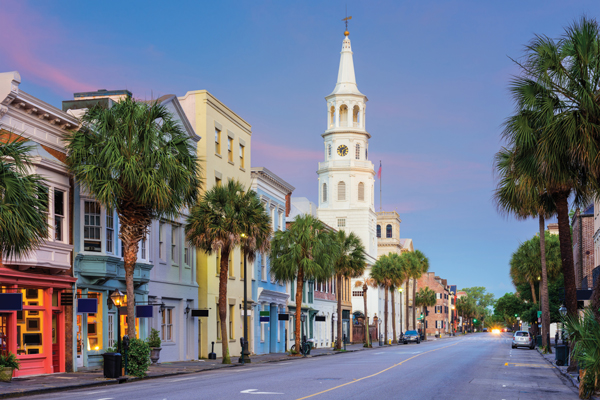
The metropolitan areas where the socioeconomic gaps have diverged the most are located along the Atlantic and Pacific seaboards with Charleston, SC among the leaders as more wealthy people move to the southern coastal city.
Out of the 100 largest metropolitan areas surveyed, El Paso, Texas, saw the least change in wealth gap, with its average income going from $128,600 to $131,200.
These are the top 10 cities where the wealth gap widened the most between 2011 and 2016, with income gaps reflecting differences between incomes in the top and bottom 20% of households:
10. Baton Rouge, La.
Income gap in 2011: $142,800
2016: $185,800