Inflation continues to be an economic irritant in the U.S., in some cities more than others, according to a new ranking by WalletHub.
While inflation has been closer to 2% for most of the 21st century, average consumer prices in February 2023 were 6% higher than one year ago, when inflation hit a 40-year high, according to the Pew Research Center.
"This high inflation is driven by a variety of factors, including the continued presence of the Covid-19 pandemic, the war in Ukraine and labor shortages," WalletHub said in its report. "The government is hoping to continue to rein in inflation with additional interest rate hikes this year, but exactly how much of an effect that will have remains to be seen."
To find the states where inflation is rising more quickly, WalletHub looked at consumer price data for 22 major U.S. metropolitan areas, comparing CPI changes over the past year, and the past two months.
Here, in ascending order, are the 10 cities where inflation is rising the fastest, according to WalletHub.
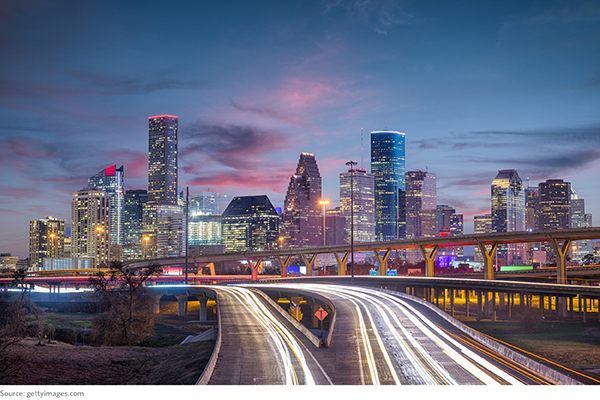
10. Houston-The Woodlands-Sugar Land, Texas
Greater Houston is the fifth-largest metropolitan area in the U.S. The two-month CPI change was 1.90%, and ithe one-year change was 5.20%.
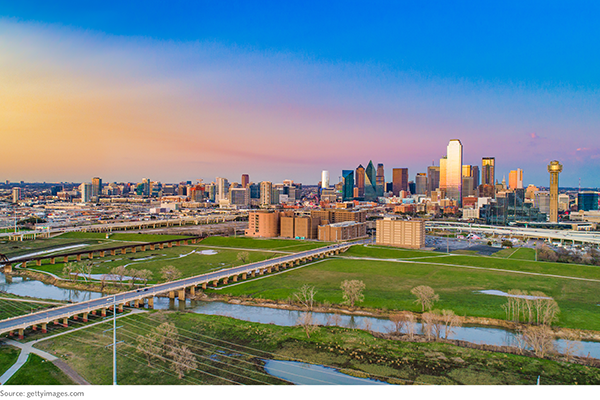
9. Dallas-Fort Worth-Arlington, Tex.
The Dallas-Fort Worth-Arlington MSA, also known as Silicon Prairie, is the most populous metropolitan area in Texas. The two-month change in the CPI was 0.80%, and the one-year change was 7.50%.
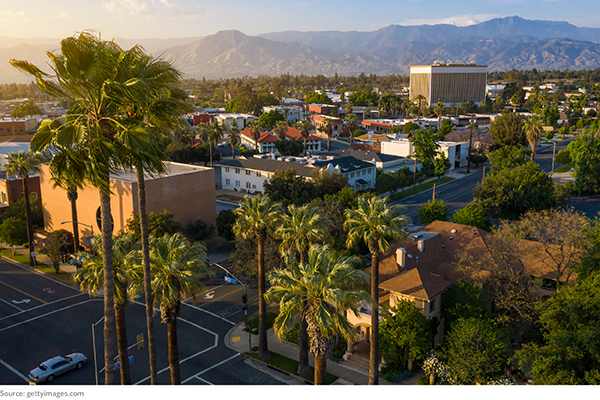
8. Riverside-San Bernardino-Ontario, Calif.
Dubbed “The Inland Empire” in 1914 by a local newspaper referring to its inland proximity to Los Angeles and the Pacific Ocean, this is the 13th largest metropolitan area in the U.S. The two-month price change was 1.30%, and the one-year change was 7.30%.
7. San Diego-Carlsbad, Calif.
Officially known as San Diego County, this metro area is also part of the San Diego-Tijuana transborder metropolitan area, the largest shared by the U.S. and Mexico. The two-month pricec change was 1.80%, and the one=year change was 6.40%.

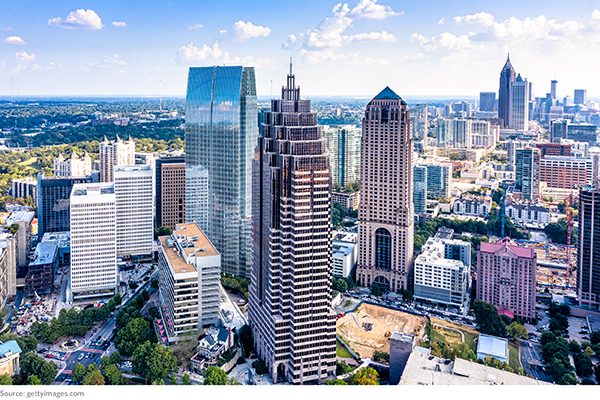
6. Atlanta-Sandy Springs-Roswell, Ga.
Metro Atlanta is the eighth largest in the U.S. The two-month price change was 1.50% and the one-yearr change was 7.20%.
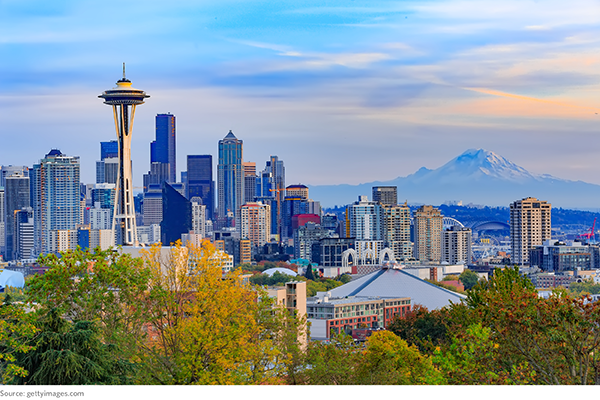
4. Seattle-Tacoma-Bellevue, Wash. (tie)
The Seattle Metropolitan area is the 15th largest in the U.S., boasting a median household income of $110,800, according to the 2020 U.S. Census. The two-month price change was 1.40% and the one-year change was 8.00%.
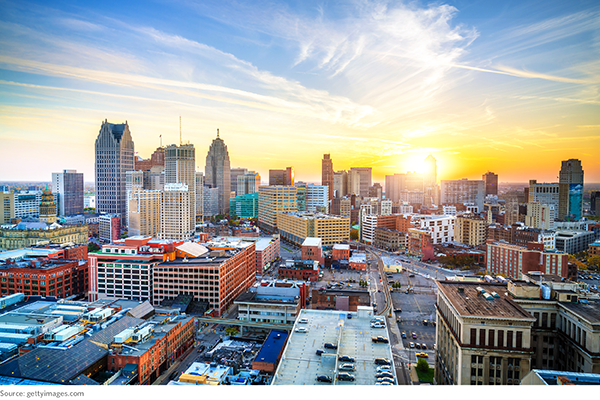
4. Detroit-Warren-Dearborn, Mich. (tie)
This metro area is the 14th largest MSA in the U.S. The tw-month price change was 1.90% and the one-year change was 7.00%.
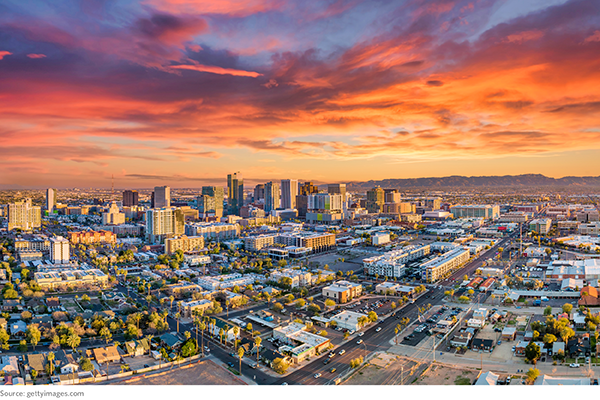
2. Phoenix-Mesa-Scottsdale, Ariz. (tie)
The metro Phoenix area is the sixth-largest based on land size and the 14th most populous. The two-month price change was 1.20% and the one-year change was 8.50%.
2. Philadelphia-Camden-Wilmington, Pa.-N.J.-Del.-Md. (tie)
The Delaware Valley spans four states, making it the nation’s seventh-largest metro area. The two-month price change was 2.00% and the one-year change was 6.90%.

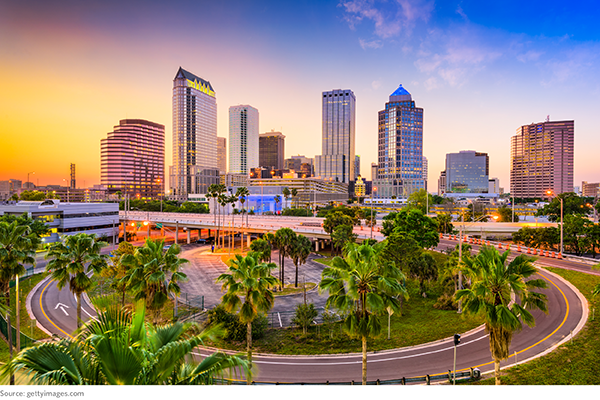
1. Tampa-St. Petersburg-Clearwater, Fla.
Comprised of four counties with a combined population of more than three million people, this metro area is the 18th largest in the nation. The two-month price change was 1.70% and the one-year change was 8.90%.
The full report can be viewed here.