I’m wrong a lot, which is the reason I chose a career—quantitative financial trading—in which you can get rich if you’re right only 51% of the time. Two years ago I considered valuations in the residential housing market and concluded:
The good news is this is not a disaster market. There’s no evidence home price declines could threaten the financial system, nor create mass economic distress as we saw after 2007. . . . The bad news is there’s a lot more downside than upside for average homebuyers, and some of them are very likely to suffer in 2021.
Homeowners did not suffer in 2021. The Case-Shiller National Home Price index was up 19%, far outpacing inflation at 7%. Unfortunately, all of the reasons I put forth to suggest the housing market was not facing a disaster melted away.
I started by considering the price-to-earnings ratio for residential real estate, which is how many years it takes for net rental revenue to equal the purchase price of a house. I applied the idea behind Yale University professor Robert Shiller’s Cyclically Adjusted Price Earnings (CAPE) ratio, which averages the prior 10 years of earnings (rents in this case) adjusted for inflation. The chart below shows housing CAPE since 1995. (This is my calculation based on data from the Bureau of Labor Statistics (Consumer Price Index for All Urban Consumers: Rent of Primary Residence in US City Average) and the S&P/Case-Shiller U.S. National Home Price Index with my own assumptions about average ownership costs of housing.)
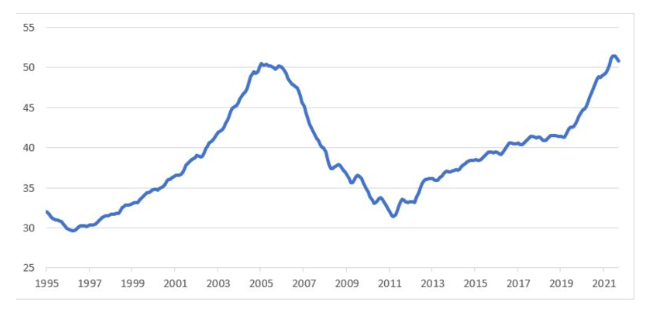
Two years ago, when the housing CAPE was 42, I took comfort from the fact that it was still much lower than the 2005 peak of the last housing bubble and also that—unlike typical bubbles—the price increases were slowing rather than speeding up. Then the gains in CAPE accelerated and brought valuations to a peak exceeding the 2005 levels.
Next, I compared the housing CAPE to the S&P 500 Index CAPE. (S&P 500 and housing price CAPEs cannot be compared directly for a number of reasons. The main one is that housing cash flows are largely tax-free for most home buyers — they do not have to pay tax on the implicit income from living rent-free in the houses they own. Tax-free future cash flows naturally have higher valuations, higher CAPEs, than taxable future cash flows.) The chart below shows the dot-com bubble, followed by the blue line showing the housing bubble that preceded the 2007–2009 financial crisis. I pointed out that both historical bubbles happened in only one asset class. But since 2011 we saw similar valuation increases in not only stocks and housing, but other assets as well. I used this to argue we weren’t in a housing bubble, and we were instead seeing an economy-wide inflation in asset prices likely due to extremely loose monetary policies. Why inflation showed up in asset prices but not consumer prices is a mystery. But my point was that inflation would likely correct as years of economy-wide low asset returns rather than a sudden crash in home prices.
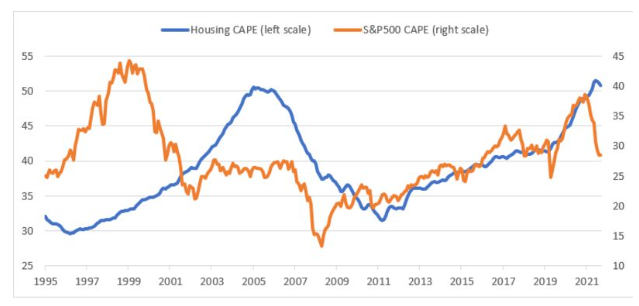
Here, too, things quickly changed. Consumer inflation roared back and stock market valuations crashed, but home-price valuations continued skyward. Monetary policy did not revert to normal but loosened throughout 2020 and 2021.
My final reason not to panic was the relation between home prices and interest rates. Normally, higher rates cause home valuations to decline. Most of the money used to buy houses is borrowed, and higher costs of capital mean lower present value to future cash flows (in the case of a home buyer, the future cash flows are savings from not paying rent).
The next chart shows residential housing CAPEs versus the 10-year U.S. Treasury yield during four subperiods. (I had only the first three subperiods in my 2020 column.) The blue dots from 1995 to 2002 show a normal housing market. Lower rates lead to higher CAPEs. But the orange dots in the bubble period from 2003 to 2013—both before and after the crash—show the price/rate reversed. Lower rates led to lower home prices. The reason is home buyers were not relying on traditional sources of capital, but on money from structured product investors. When prices were going up, home buyers were getting loans at far below 10-year Treasury yields; after the crash, home buyers had trouble getting capital at any rate. Moreover, during the bubble period, many borrowers didn’t care about rates because they had no intention of making payments—they’d sell the house at a profit or walk away.
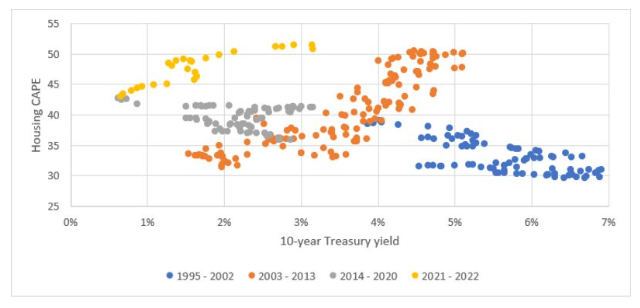
Two years ago, looking at the grey dots from 2014 to 2020, I argued that housing prices had returned to their normal relation with rates. That led me to predict valuations would fall gradually as rates rose—either due to monetary tightening or, if that didn’t happen, increased inflation expectations.
But then the yellow dots happened. Home valuations increased as rates increased, just as in the housing bubble. Perhaps that is turning around now, as housing prices are beginning to decline (typically before we see large price declines we see softening markets—fewer buyers and sellers, longer delays between listing and sales—as have been happening in the last few months) and the Fed is raising rates. But looking at the data so far, it looks like a bubble.
Maybe you shouldn’t pay much attention to what I think now, since I was exactly wrong two years ago. But I’m still not panicking about a housing crash. I expect valuations to revert to long-term mean because rents will continue to increase rapidly, meaning no dramatic drop in home prices is necessary. I base that on expectations for more legal immigration and legalization of existing undocumented immigrants and lifestyle changes—mainly more working from home—triggered by the pandemic, but not reverting to past practices.
Other factors are the eviction moratoriums of the last two years discourage renting and construction of rental housing, and the massively inflated money supply has to go somewhere. I think the student loan forgiveness increases home buyers’ expectation of mortgage forgiveness if prices decline. After all, that almost happened in 2008, and it will be hard for politicians to ignore the cry, “You bailed out rich college graduates, why not hard-working middle-class homeowners?”
But if I’m wrong about a rapid escalation in rents, everything seems to be in place for a historic crash in housing prices, inflicting broad economic damage.
Aaron Brown is a former managing director and head of financial market research at AQR Capital Management. He is author of The Poker Face of Wall Street. He may have a stake in the areas he writes about.