The law of gravity states that what goes up must come down. But the laws of economics say that investors generally are rewarded for staying invested.
Stocks are hitting all-time highs right now, but what does that mean for investors? The phrase “all-time high” conjures up the image of a stock chart at its peak. But while all-time high is accurate in terms of describing the market relative to the past, to some it also implies that the market may be overvalued and primed for a fall.
However, the markets go up and down all the time, and they tend to go up more than they go down. So just because the market is higher than it has ever been does not mean that it is soon going to fall. In fact, the market has spent much of its history at an all-time high.
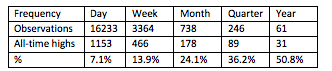
While it’s slightly unusual for the market to close at an all-time high on any given day throughout history, most investors don’t move in and out of the market on a daily basis. For more relevant investor scenarios, the market being at or near a high is historically common. For example, since March 1957 (when the S&P 500 began in roughly its current form), 178 months have ended in market highs—that’s approximately 24.1 percent of the time. When looking only at year-end, more than half of the years since 1957 have ended higher than any previous year.
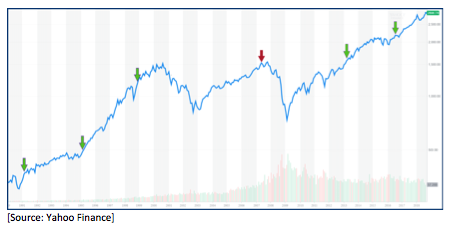
While the two previous market highs of July 2016 and March 2013 were followed by positive 18.9 percent and 13.9 percent 1-year returns, respectively, the market high prior to the global financial crisis is the exception everyone worries about. The brief 2007 peaks followed the long recovery from the tech bubble with unfortunate timing. The 1-year forward return from that market high (5/30/2007) was -7.8 percent, but that was just the beginning of the market decline. The S&P has nearly doubled since then, but the event remains in the minds of investors today. The following graph highlights how much higher the market continues to climb even after each market high (depicted via the arrows below).
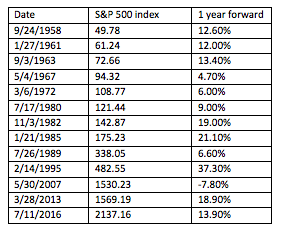
To put these market highs in perspective, we list the distinct new market highs for the S&P 500 since 1957. To avoid repeated observations, I define distinct market highs as daily market highs that were not preceded by another all-time high in the previous year:
I make no claim to be able to predict the future. And I certainly do not imply that this pattern will so favorably continue, but looking at the data can assuage fears: investors should not look to sell every time the market goes up. The markets are not subject to the laws of gravity.
As I said in an earlier blog post about the Dow hitting 20,000, it is not, generally speaking, a good idea to sell when stocks reach a new high. Neither new highs nor numerical milestones signal market peaks and future market declines. Historical evidence suggests that future returns are likely to be better than average at market highs, albeit with greater volatility.
Also of note, the current market high is a phenomenon specific to U.S. stocks, meaning that global, multi-asset class investors may not feel as euphoric as those who are predominantly in U.S. equities. While new highs have some investors concerned about future markets, they should treat these times like any other—focus on their ability to tolerate risk and stick to a well-diversified investment plan. Odds favor the consistent investor.
At the time of the writing, the S&P 500 (2,898), NASDAQ Composite (8,030) and Russell 2000 (1,728) were at all-time highs. The ACWI (525) global index, Bloomberg Agg (2,024) bond index and the New Frontier NFGBI (258) balanced index were not.
Robert Michaud is co-founder and chief investment officer at New Frontier Advisors.