Gleanings
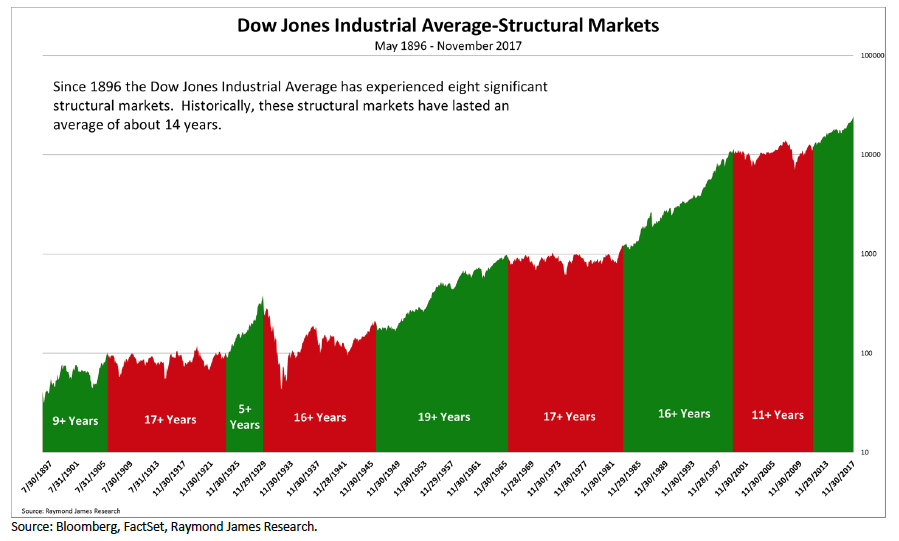
Structural Bull Markets
The green areas are what structural, or secular, bull markets look like. On average they last 14+ years and tend to compound returns at 15+ percent. We don’t think it is any different with the current secular bull market.
As Can be Seen From 1982–2000, Secular Bull Markets Tend To Have Three Legs To Them
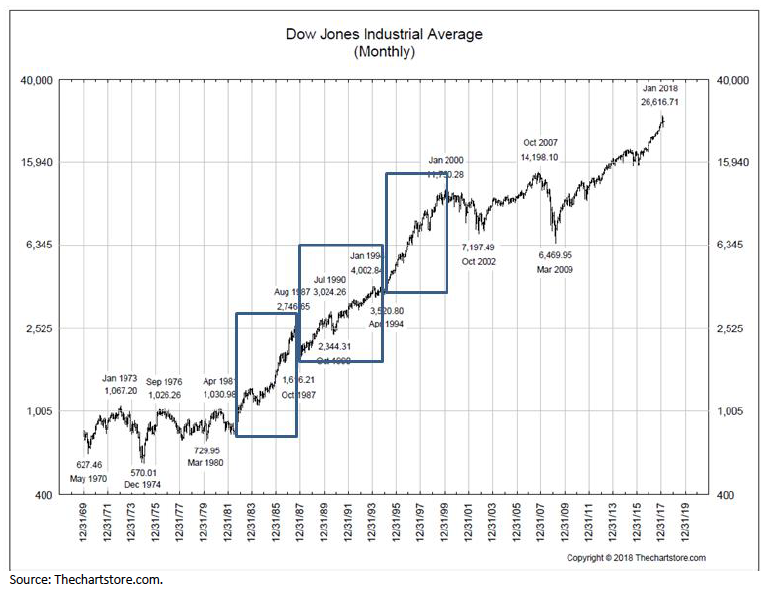
Second Leg—Longest And Strongest
We think the first “leg” of this secular bull market began on October 10, 2008 when 92.6 percent of all stocks traded made new annual lows. Sure, the major averages went lower into the March 2009 lows because the Financials kept going lower, but the majority of stocks bottomed in October 2008. We believe the second “leg” began in February 2016 and it should be the longest and strongest.

Third Leg—Speculative Leg
When the second “leg” ends is unknowable, but when it does the stock market should go into an upside consolidation just like it did between May 2015 and February 2016. Subsequently, it should break out to the upside and begin the third “leg,” or speculative “leg.” For the record, in the 1982 to 2000 secular bull market, the third “leg” began in late 1994 and lasted into the spring of 2000.

“Bigger Than The 1982–2000 ‘Run’…”
Using 20-year rolling returns shows when the 1982–2000 secular bull market ended, the D-J Industrial Average had returned 18.14 perent per year. As of July of last year, the Dow had returned 7.47 percent for the same 20-year rolling timeframe. If we are right about this secular bull market being bigger than the 1982 – 2000 “run,” the stock market has a lot further to go.

Bottoming Process Not Complete
Despite our conviction that this secular bull market has years left to run, after recent action, it appears the bottoming process is not complete. We had thought the S&P 500’s pullback was over with the under-cut low of February 9 (~2533) and said that low should not be retested. Well, after last week it looks like it will be retested. Over the weekend, we received this excellent summation of the stock market recent gyrations from our friend and portfolio manager Craig White of the HugganWhite Wealth Management firm. To wit:
Has the market become a “sick patient” with viral implications or is it still suffering from indigestion due to the adverse surfeit of unsettling headlines?Certainly the “health” of the market has come under question again this week, as the latest executive memo signed by Donald Trump imposing a $60 billion retaliatory tariff on certain Chinese imports triggered another round of intense selling pressure. Despite the mid-day attempt amongst the bulls to regain some positive momentum, the selloff intensified into the close and a number of technical support levels were violated. Thursday’s tape action was indeed the second worst for 2018 with the Industrials losing 2.93 percent, the S&P 500 falling 2.52 percent, and the NASDAQ and Russell 2000 shedding 2.43 percent and 2.24 percent. The marginal pick up in volume reveals that selling has intensified, with final data showing that 90 percent of total volume on the NYSE was to the downside. New highs were anemic as expected, while lows were again elevated at 116 (of note, this reading is still substantially lower than the 479 witnessed on February 6th). Treasury yields also closed lower with the 10-year settling in at 2.83 percent, now 10 basis points off of the failed move to 2.94 percent of Wednesday’s FOMC announcement. Evidently, the 2019 and 2020 dot plot expectations are being overlooked at this juncture, a tact we would agree with as Fed member expectations for two years hence should be viewed with caution. From a technical perspective, equity markets are still working through the bottoming process that began in early February and have since been digesting the onslaught of news with fits of optimism, followed by uncomforting pessimism. Between the early February trading lows and the recovery highs of March 9th, the 200-point trading range has both the bears and the bulls looking for a diagnosis as to where the next sustainable trend lies. … the choppy pattern we have witnessed continues to fall within the expectation of a consolidating market thus far. …we would advise patience and diligence at this time and remind investors to follow the underlying fundamentals, not policy. As Raymond James’ Washington Policy analyst Ed Mills states, “While these headlines represent an increase in the policy headwinds coming out of D.C., we are reminded that in our experience almost all policy outcomes are never as bad as you fear, nor as good as you hope.” Sage advice indeed.
Ultimately, we believe the foundation that has served this bull market will once again move to the fore when this indigestion subsides. Supporting this are robust earnings with 2018 EPS projected to grow at 19 percent, valuations that are becoming increasingly more attractive at a 17x forward multiple, and the threat of a yield curve inversion muted for the bulk of 2018 at this time. Thus, the volatility that was effectively non-existent throughout 2017 should be viewed as an opportunity to increase equity exposure, in particular near lower price levels of this developing support/resistance channel as mentioned above.
Jeffrey D. Saut is chief investment strategist at Raymond James.