


Want to know where the S&P 500 Index may be headed after reaching another record high? Take a look at profit margins.
Operating margin forecasts are a strong leading indicator of stock prices. A decline in such outlooks preceded routs in the S&P 500 in 2011, 2015, 2018 and 2020. What’s concerning now is that analysts have stopped raising their forecasts, and if they begin to lower them, it's likely to lead to a dip in the broader market again. And it’s not like there’s a lot of room for further improvement in margins, defined as earnings before interest and taxes divided by sales. The consensus among analysts is that they will expand to 16.7% over the next 12 months, topping the previous record of 16.4% set in 2018.
The relationship between S&P 500 profitability and inflation indicators is murky at best, but recent spikes in the producer price index and a smaller increase in the consumer price index is enough to raise a caution flag for equity margin expansion potential for the next few quarters. At its peak in April, the PPI rose 9.5% from a year earlier, almost 3 standard deviations above its average over the past 30 years. (It rose 9.4% in June.) From 2010 to 2019, the median estimate of where operating margins would be 12 months into the future for S&P 500 members were negatively correlated to changes in PPI. The current coefficient of minus 0.22 suggests gains in corporate profitability are likely to stall or even fall as producer prices continue to rise.

The difference between the PPI and CPI suggests companies are unable to pass cost increases on to consumers. The spread between the two fell to a record low of minus 5.3 percentage points in April, and is still strongly inverted at minus 4.1 percentage points. Over the last 30 years, the operating margin for the S&P 500 narrowed 6.5 percentage points on average one year after the gap fell below minus 2 percentage points. Not only that, but in the year after the spread breached minus 2 percentage points, the S&P fell 2.5% on average.
Analysts are getting nervous. They have cut their margin estimates for a quarter of S&P 500 members in the last three months. Their stocks were down 0.63%, compared with a gain of 2.20% for the index and a 3.30% increase for companies with rising margin forecasts. Slicing the index into quintiles based on changes in operating margin shows that companies with the largest declines had a median stock-price decline of 0.5%, versus a gain of 3.9% for those with the greatest expansion in consensus estimates.
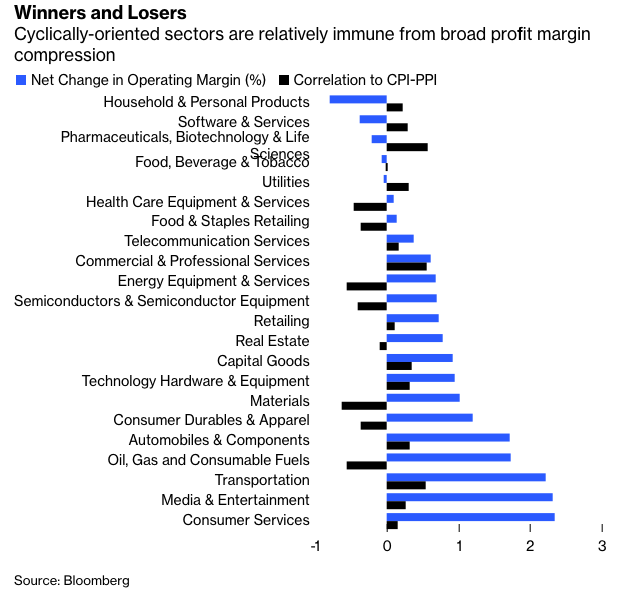
Industries with the most negative margin pressures are likely to be those that investors historically consider “defensive,” such as health care, utilities and consumer staples. Large companies involved in pharmaceuticals, biotechnology and life sciences, household and personal products, and utilities have historically fared worst when producer prices outrun consumer prices, and these are where margin forecasts gave dropped the most over the last three months. Margins forecasts continue to rise for the more cyclically-oriented segments of the equity market, with media, consumer services, transportation and oil and gas industries having the largest gains.
Though consensus expectations imply smooth sailing, companies are set up for a more challenging margin outlook as revenue growth rates likely fade, but inflation pressures remain relatively high given persistent uncertainty in the supply chain. Against this backdrop, currently selective industry margin weaknesses may start to spread to more industries, resulting in degradation of margin forecasts for the index at large. Given these estimates are a strong strong leading indicator of stock-price direction, margin trends may be a critical risk to the equity market in the months ahead.
Gina Martin Adams is the global head of equity strategy, ETF and ESG research and chief equity strategist for Bloomberg Intelligence. Prior to joining Bloomberg, she was the head of U.S. equity strategy for Wells Fargo Securities.