With the oil market futures curve in backwardation and likely to remain so for the foreseeable future, the topic of roll yield has been top-of-mind for many commodity investors. Yet we often hear market participants promote a misconception about this key driver of returns by conflating it with carry – a miscue that may lead investors to underestimate the value of commodity investments.
Generally speaking, carry is a measure of the return that can be expected over the next 12 months assuming spot prices and valuations do not change. In the context of commodities, roll yield is a contributor to carry, and refers to returns generated as a longer-term futures contract over time “rolls” into a shorter-term contract as it nears expiration. However, many investors overlook what we view as a key component of carry for commodities: the short-term rate earned on the collateral underlying these unfunded investments.
Essentially, as we explain in greater detail below, we believe calculating commodity carry boils down to a simple equation:
Commodity carry = roll yield + the short-term rate
Today, estimates of one-year carry that incorporate the short-term rate suggest that investors in a broad commodity basket (such as the Bloomberg Commodities Index) are being paid to hold an asset class that can serve as an inflation hedge while providing diversification from equity and fixed income risk. A better understanding of the distinction between roll yield and carry and the importance of the short-term rate may thus help commodity investors more accurately gauge potential returns.
Commodity roll yield: what it is (and what it isn’t)
To gain insight into commodity carry, we can draw a parallel to bond investing. In fixed income, carry assumes markets (i.e., yields and spreads) remain unchanged and is calculated by taking the yield of the bond plus the roll-down return. While the concepts of roll down and yield are well understood in fixed income investing, we’ve found that in commodity markets, participants frequently equate the concept of roll yield to the notion of carry – after all, commodities don’t pay a coupon/yield. But roll yield, as important as it is, doesn’t tell the whole story.
Roll yield in commodities has always been of great interest to both advocates and skeptics of the asset class. We have written before about its implications for investors—in particular, why roll yield is a strong driver of future returns and why we view a backwardated (downward-sloping) crude oil futures curve as a trade signal to invest in commodity markets. Historically, a backwardated oil curve has been a strong predictor of positive future performance. This tendency has been borne out again recently, with generally strong oil and commodity returns in the months since the oil market shifted from contango into backwardation in the fall of 2017.
Here is how roll yield works, in a nutshell:
With long commodity futures positions, the current futures contract is frequently rolled to the next-out contract before it expires. This prevents the contract holder from having to take physical delivery of the underlying commodity. When commodity futures curves are upward-sloping, the next-out contract will trade at a higher price than the current contract. If the curve does not change, the newly purchased contract “rolls down the curve” as it gets closer to expiring, thereby falling in price and generating a negative roll yield. When commodity curves are downward-sloping, the opposite is true: The distant contracts trade at a lower price, and the prices “roll up the curve,” thereby generating a positive roll yield. In commodity circles, upward-sloping, negative-roll-yield curves are said to be “in contango,” while downward-sloping, positive roll yield curves are said to be “in backwardation.”
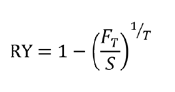
Mathematically, the roll yield (RY) can be roughly expressed as one minus the annualized ratio of the futures price (FT ) and the spot price (S):
Whether an investor is trying to benefit from backwardation or is contending with a contango curve, roll yield will be an important factor in long-term returns. However, roll yield is not equivalent to the carry from a commodity investment, and ignoring short rates when considering roll yield may lead to faulty conclusions.
Calculating Commodity Carry: The Short-Term Rate Is Key
Investments need to be compared on a like-for-like basis. With most investments, the investor must pay the full nominal price for the asset, so we think about their returns on a fully funded basis. However, investments in commodity futures are unfunded. To make meaningful comparisons with other investments, we need to look at commodities on the equivalent of a fully funded or fully collateralized basis.
Including the short-term rate earned on the collateral investment when calculating commodity carry helps to achieve this, and it makes intuitive sense given the inputs that determine the shape of commodities futures curves (and therefore the achievable roll yield). Consider the futures equation below:
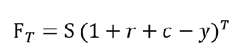
Where (FT) is today’s futures price for delivery in (T) years;
S is today’s spot price;
r is the short-term rate;
c is the storage cost; and
y is the convenience yield
As we can see, the higher the short-term rate (r), the larger the difference between the spot price and the futures price – and thus the lower or more negative the commodity’s roll yield, all else being equal. However, that is for an unfunded investment; at the same time, a high short-term rate will also increase the yield earned on the collateral backing the commodity futures. The two are offsetting: As the short-term rate moves higher and creates lower roll yields, it also increases the return on the collateral. Given this direct link, we believe the short-term rate and roll yield should be considered together when estimating commodity carry.
Case Study: Gold
Gold provides a good illustration of the direct link between commodity roll yield and the short-term rate, given its minimal storage costs and typically low convenience yield. We looked at the backdrop for gold in two very different market environments: 2006 and 2012.

As Figure 1 shows, the roll yield figures alone suggest that headwinds for gold futures investors were much greater in 2006 than in 2012: In 2006, short rates were north of 5 percent, and the roll yield was similarly negative. So, should the hypothetical investor of 2006 avoid gold futures because the roll yield is negative? What if they were to purchase physical gold to avoid the negative roll yield?
This example reinforces the importance of comparing assets on a like-for-like basis. In the futures market, an investor is gaining exposure without putting up the full notional amount of the asset, so we must give credit for the ability to invest that excess cash. In the example above, once we factor in the offsetting impact of the short-term rate (i.e., Libor), the effective carry is essentially zero. And because physical gold also essentially has a yield of zero, the choice between owning gold futures and owning physical gold is a wash. (We would argue that even though gold pays no coupon, its price has historically kept up with inflation. Thus, it would be most accurate to say its real yield is zero, in our view.)
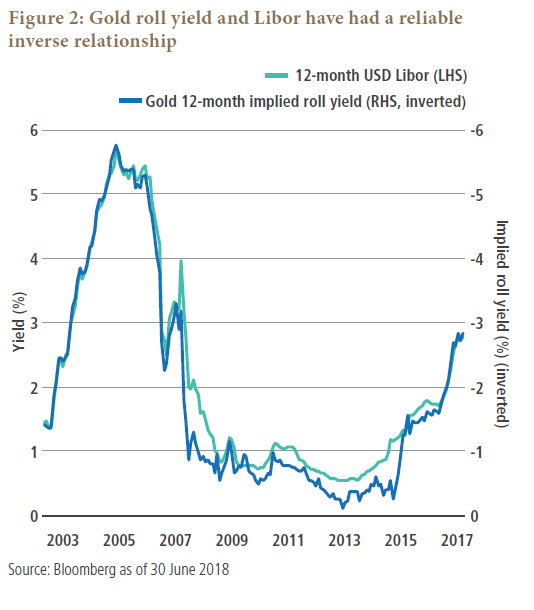
Notably, the carry is the same for gold futures in both 2006 and 2012, once the short-term rate (Libor) is factored in. As Figure 2 shows, the strong negative correlation between Libor and roll yield for gold has held up well over time, and the carry has been essentially zero quite consistently.
Key Takeaways
To sum up, we believe roll yield alone provides an incomplete view of commodity carry that is not directly comparable to the carry of other asset classes. Investors who focus solely on roll yield without considering the short-term rate earned on the collateral may be systematically misestimating carry and the value of commodity investments. In times when rates are rising, like today, this adjustment becomes even more important and may result in carry numbers that are both more realistic and more compelling, especially considering commodities’ strong diversification and inflation-hedging properties.
Nicholas J. Johnson is a managing director and portfolio manager focusing on commodities at PIMCO. Klaus Thuerbach is a senior vice president and product strategist focusing on liquid real assets at PIMCO.