
We may be witnessing history in the making. The current cycle of business expansion in the U.S. is poised to become the longest ever recorded in this country. According to the National Bureau of Economic Research, which maintains the government’s official record of U.S. business cycles, the current expansion began in June of 2009 and is now just shy of tying the 120-month record set by the expansion of March 1991 to March 2001. By the time you read this article, the record may have been broken.
So it’s time to celebrate, right?
Some are celebrating. But many are not. The longer the current expansion lasts, the more people become convinced first that it will end soon and second that the inevitable recession following it will be severe.
Today, fear and pessimism seem to reign, likely because of the lingering memories of losses incurred during the 2008-2009 financial crisis. But while the economy may be in a later phase of expansion, there are critical differences between the economic conditions today and the periods before other dislocations. We contend that while a future recession is all but inevitable, its actual severity—as measured by common methods and standards—might be less than what’s feared.
Signal Of Another Recession?
As for the first prediction—that the expansion will end soon—the pessimist camp gained considerable strength on March 22 when the yield on three-month Treasury bills briefly surpassed the yield on 10-year Treasury bonds, representing the first such yield-curve inversion since 2007. Historically, an inverted yield curve has been a reliable predictor of recessions. The Federal Reserve Bank of St. Louis has observed the yield curve since 1982 and notes that the curve inverted before the recessions starting in July 1990, March 2001 and December 2007. Besides the yield curve, other economic indicators, such as slowing corporate earnings, have also stoked concern about another recession.
A Forest Fire Or Just Plucking?
What about the second dire prediction—that the next recession will be severe? Will it be more so because the expansion that preceded it was so long? In a recent paper with an intriguing title, “A Forest Fire Theory of the Duration of a Boom and the Size of a Subsequent Bust,” two prominent economists, Matthew Jackson (of Stanford University) and Pietro Tebaldi (from the University of Chicago), argue that the length of an expansion is, in fact, correlated to the severity of a subsequent recession. During a protracted expansion, they argue, economic imbalances are invariably created and increasingly accumulated. These imbalances grow into larger and larger stockpiles of dry kindling material, and when the next recession occurs, the match is lit. The resulting forest fire is larger because there is more accumulated dry fuel to feed it.
Perhaps. But not necessarily.
Earlier this year, the Federal Reserve Bank of Cleveland published a paper, “Do Longer Expansions Lead to More Severe Recessions?” by Murat Tasci and Nicholas Zevanove. It contends that the “forest fire” theory isn’t supported by evidence; nor is it necessarily true that longer expansions are followed by severe recessions. In fact, the authors assert, the length of the current expansion is actually tied to the strength and depth of the Great Recession that preceded it. They rely in part on Milton Friedman’s “plucking” model, which suggests the economy is like a tight string that gets plucked down from time to time by myriad disruptive forces. The size of the pluck (or contraction) can predict the size of the ultimate reversion (or expansion) to normal output levels.
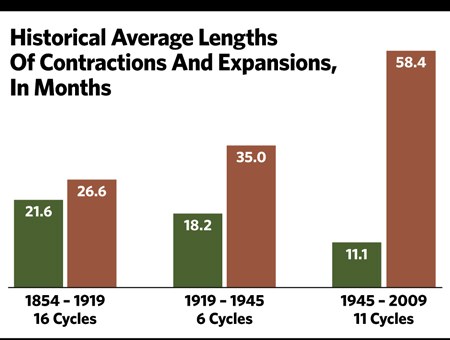
Further support can be found for this latter line of reasoning by comparing the historical average lengths of the contractions and expansions that have occurred since 1854 (as reported by the National Bureau of Economic Research). If anything, the trend is that U.S. economic expansions are lasting longer, while economic contractions have become substantially shorter in duration.
Also, while the current expansion has been long by historical standards, the recovery in GDP has been relatively shallow. This could allow for an even longer expansion.
Gauging Severity
But we should discuss the parameters for what makes a recession mild or severe. The National Bureau of Economic Research has vaguely defined a recession as “a significant decline in economic activity spread across the economy, lasting more than a few months, normally visible in real GDP, real income, employment, industrial production and wholesale-retail sales.” Based on this definition, we could think of severity in terms of duration, or we could think of it in terms of depth, likely measured by the magnitude of GDP contraction or by losses in income, employment, production or sales.
These measures do matter. They affect people, businesses, communities, the country and the entire world in a variety of largely negative ways. But the reality is that, in the modern age of streaming information, 24-hour news cycles and interconnected markets, almost everybody (except economists) measures the severity of recessions primarily by the health of the financial markets. Consider the recession of 1973-1975. While it was protracted in length, it saw only a minimal decrease in GDP. Yet, because of the extreme bear market associated with this recession, many think of it as among the worst ever.
 The same can be said of the recession of 2001. By most measures, this recession, which followed a 10-year expansion, was relatively mild. It lasted for eight months, had little impact on GDP and saw only a slight decline in employment. Yet it will forever be associated with the bursting internet bubble and the subsequent dramatic losses experienced by the financial markets.
So let’s imagine the next recession in terms of the financial markets. Since 1946, the S&P 500 has suffered through 11 bear markets, which, for this purpose, we will define as a 20% or more decline. Almost all of those bear markets were tied to economic recessions, and their average peak-to-trough decline was about 34%. Averages, however, can be misleading. If we take the three worst markets out of the calculation, the average decline was only 27%. These three extreme bear markets—which we’ll call the grizzlies—were each associated with a recession but shared characteristics absent today. There was a 48% decline associated with the recession of 1973-1975, a 49% decline associated with the recession of 2001 and a 56% decline associated with the Great Recession of 2008-2009. What differentiates these three periods from others is that, in 1973, 2001 and 2008, the U.S. economy experienced an irregular buildup of harmful imbalances that led to and exacerbated the ensuing recession. In the case of the two most recent recessions and associated bear markets, the irregularities primarily took the form of bubbles in the internet and housing sectors. An external shock inflamed the more distant recession of 1973-1975—a sharp rise in oil prices resulting from the oil embargo launched by the Organization of Arab Petroleum Exporting Countries (OAPEC).
1973-1975 Recession
According to the National Bureau of Economic Research, the recession of 1973-1975 lasted from November 1973 to March 1975. While in most cases no one factor ultimately triggers a recession, the 1973 oil crisis was a leading catalyst for the start and longevity of the recession of 1973-1975. In October of 1973, OAPEC launched an oil embargo that lasted for about five months. The embargo and following rise in oil prices acted as a catalyst for the recession that would officially start the very next month. This external shock aggravated other recessionary symptoms and plunged the U.S. financial markets into one of their worst downturns on record. When it was all over, that recession led to the worst post-Great Depression stock market in nearly 30 years.
2001 Recession
As for the recession of 2001, it is one of only two economic contractions that this country has experienced in the past quarter century. And, like the recession of 1973-1975, it had the distinction of being precipitated by unusual imbalances for which the economy was unprepared. By the end of 2000, the economy had become overly invested in internet and other technology companies with unsustainable or otherwise faulty business models. These excessive valuations created a bubble that, like all other bubbles, ultimately burst, leading to a near halving of the S&P 500’s value.
The 2001 market downturn was again a product of an imbalance, this time in the form of a financial bubble. Yet other shocks worsened the situation even further. The terrorist attacks of September 11, 2001, a warning by Alan Greenspan that the Federal Reserve would begin aggressively raising interest rates and the announcement of a recession in Japan all exacerbated the ultimate selloff.
Again, in the National Bureau of Economic Research view, the 2001 recession was relatively brief and benign. In fact, the bureau considers the 2001 recession to be one of the shortest in history. But the structural imbalances and external shocks aggravated the associated bear market and turned it into one of the worst ever.
2008-2009 Recession
Then there is the financial crisis—or Great Recession—of 2008-2009, which, by many metrics, was the worst recession the U.S. economy has experienced since the Great Depression. While much has been written about its complex causes, the 2008 downturn was preceded by a housing market bubble, which burst at the end of that year and had been inflated in part by the proliferation of financial derivatives. These conditions were inflamed by the failure of several large financial institutions and the exposure of massive financial frauds.
The Great Recession lasted for 18 months, and the attendant bear market prompted a 56% loss in stock market value.
Today
So what does all of this information tell us about the next recession—whenever it may occur? Quite a bit, actually.
First, just because the latest expansion has been so long doesn’t mean by fact, principle or logic that the next recession must be severe. Historical patterns do not support this fear, and in fact it’s reasonable to expect longer expansions and shorter contractions. Again, the long current expansion is probably more about the last recession than the next one.
Second, if we are gauging the next recession by the financial markets, then we should also be looking for indications of developing imbalances or shocks. Without those, the bear markets associated with recessions since World War II have been far less grizzly, yielding average losses of less than 30%.
So is there any kind of imbalance right now that could cause a grizzly bear market? There’s no way to know for sure, but if there were imbalances, they likely would be more noticeable by now. The excesses in the housing market in the 2000s were evident to many people, as were the high dot-com valuations before that. Less obvious, of course, was how large these bubbles had become and how painful and sudden their deflation would be.
This is not to say there aren’t areas of concern. Some might argue that equity valuations have become high enough to be called imbalanced, which could lead to a harsher recession.
The rising level of global debt, mainly corporate debt and sovereign debt in certain countries, also deserves scrutiny. The sovereign issue might be sustainable for the long term since most nations can control their currency supplies. In the corporate sector, however, debt-to-cash metrics indicate that U.S. companies are increasingly leveraged, which could mean trouble in a recession. Nevertheless, according to data from the Fed and the St. Louis Fed, new corporate debt issues declined in 2018, and the amounts of outstanding total debt securities are plateauing. That should ease some concern.
Also keep in mind that much of the debt in place today was issued at favorable (i.e., lower) interest rates, making the larger debt amounts easier to service.
Conclusion
The U.S. economy is in one of its most prolonged expansions in history. While people are anxious about the timing and gravity of the next swoon, there is good reason for optimism. Not all economic downturns are created equally. The economy operates in cycles. For every expansion period, there is a corresponding contraction. While current debt levels are certainly a cause for concern, there does not appear to be another major imbalance like the dot-com or housing bubbles on the horizon, and imbalances that have exacerbated previous recessions and fueled larger market losses are not readily apparent at this time.
To be clear, the inversion of the yield curve earlier this year rightly caused many to pause and reflect on the current and future state of the economy. It’s even possible that we may already be heading into a recession. The National Bureau of Economic Research frequently publishes data well after recessions have started or even at their conclusion. The 2001 recession ended in November of that year but was not declared to have occurred until November 26—when it was already over!
It must also be noted that a geopolitical shock or other outside force could change all the current conditions. These are simply impossible to predict.
Nevertheless, while caution is vital, there is reason to believe that the cliché “this time is different” might actually be appropriate. There will be another recession, but the next one may not be as long or as deep. That means it’s important to keep the traditional advice in mind: People should avoid market timing and keep a longer-term perspective.
Michael J. Nathanson, JD, LLM, is chairman and chief executive officer of The Colony Group. Dawn Doebler, MBA, CPA, CFP, CDFA, is a senior wealth advisor at The Colony Group. Anthony J. Sadler is an M&A Business Analyst at The Colony Group. In addition to the authorities cited in the article, the authors utilized information presented in The Colony Group’s newsletter, Market Perspectives.