Millennials are the most popular and the most picked on generation.
Born between 1981 and 1996, they represent the largest living generational category. The Pew Research Center has depicted millennials as educated, socially conscious, technologically savvy, health conscious, hardworking and entitled.
They are not afraid to question authority. They have delayed marriage or never married. And they have put off having children, studies have concluded. A 2018 study by Brookings noted that they are also the most diverse adult generation in American history.
Because they were hammered by the Great Recession, millennials are reluctant to buy homes and therefore more likely to move in with their parents and stay awhile, research says.
Brookings found fewer millennials as a percentage of the overall population in Florida cities such as Tampa and Miami. In the Northeast, there are fewer millennials in cities such as Pittsburgh. In the Midwest, there are fewer in Cleveland and Detroit. But are these really bad places for them?
To find out, WalletHub compared the 50 states and the District of Columbia according to five key aspects: a city’s affordability, its education and health, its quality of life, its economic health and its civic engagement. The study used 34 key metrics, ranging from share of millennials to millennial population growth to average monthly earnings for millennials to the millennial unemployment rate to millennials’ voter turnout rate.
Each of the metrics was graded on a 100-point scale, with a score of 100 representing the most favorable conditions for millennials. WalletHub then determined each state’s (and D.C.’s) weighted average across all metrics to calculate its overall score and used the resulting scores to rank-order its sample.
The following are WalletHub’s worst states for millennials, with No. 1 being the worst:
10. Kentucky
The state had an overall score of 41.94. It ranked 10th for affordability, 39th in education & health, 45th for quality of life, 36th for economic health and 44th for civic engagement.

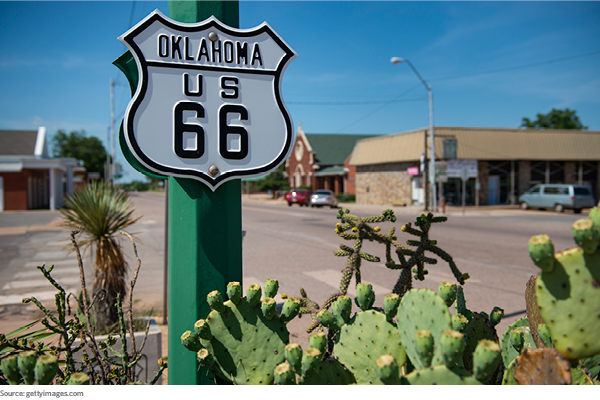
9. Oklahoma
The state had an overall score of 41.63. It ranked 23rd for affordability, 50th in education and health, 44th for quality of life, 41st for economic health and 31st for civic engagement.

8. Alaska
The state had an overall score of 41.57. It ranked 50th for affordability, 40th in education and health, 27th for quality of life, 48th for economic health and 16th for civic engagement.

7. South Carolina
The state had an overall score of 40.76. It ranked 18th for affordability, 31st in education and health, 48th for quality of life, 28th for economic health and 51st for civic engagement.

6. Nevada
The state had an overall score of 39.86. It ranked 45th for affordability, 46th in education and health, 34th for quality of life, 30th for economic health and 49th for civic engagement.

5. Louisiana
The state had an overall score of 39.60. It ranked 22nd for affordability, 45th in education and health, 43rd for quality of life, 50th for economic health and 32nd for civic engagement.

4. Arkansas
The state had an overall score of 37.40. It ranked 33rd for affordability, 49th in education and health, 47th for quality of life, 47th for economic health and 34th for civic engagement.

3. New Mexico
The state had an overall score of 36.28. It ranked 43rd for affordability, 42nd in education and health, 46th for quality of life, 44th for economic health and 48th for civic engagement.

2. West Virginia
The state had an overall score of 35.53. It ranked 24th for affordability, 38th in education and health, 51st for quality of life, 43rd for economic health and 49th for civic engagement.

1. Mississippi
The state had an overall score of 34.94. It ranked 30th for affordability, 47th in education and health, 50th for quality of life, 51st for economic health and 17th for civic engagement.

The full report can be viewed here.