Last year was pretty terrible. Hundreds of thousands of Americans died of a scary new disease, tens of millions caught it and virtually all of us had our lives upended in some way. But hey, at least we seem to have gotten more sleep!
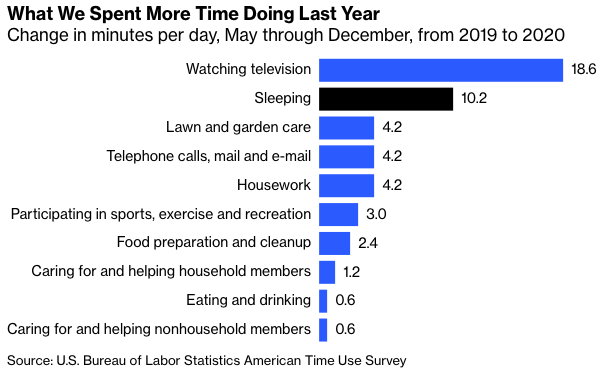
These data are from the American Time Use Survey, among the most wondrous of the statistical products of the U.S. government. The Bureau of Labor Statistics released 2020 numbers last week, and they’ve already gotten a lot of attention. The headline finding announced by the BLS was that the share of employed persons who did their jobs at least partly at home nearly doubled from 22% to 42%. Among the other things that journalists and researchers have discovered in the data so far are that employed mothers with children under 12 spent more time on child care than on their paid jobs, 12% of employed women reported working and taking care of their children simultaneously, and that men did more housework than in 2019 but still less than women.
Me, I was curious about the sleep. It’s not all that surprising that Americans got more of it in 2020, especially since the ATUS total “includes naps and spells of sleeplessness.” I certainly did (especially if you include the spells of sleeplessness during the night). But given the constant drumbeat of warnings that Americans aren’t getting enough sleep, I wondered if the pandemic year was an anomaly.
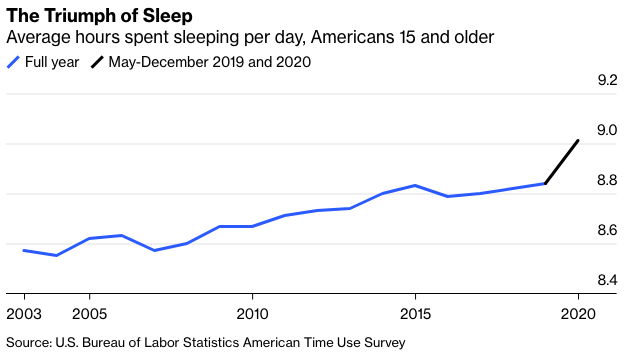
It wasn’t, really. The jump from 2019 to 2020 was especially big, but hours spent sleeping have mostly been rising since the first ATUS was conducted in 2003.
Because of the pandemic, the Census Bureau staffers who conduct the time-use survey for the BLS missed almost two months of work, which is why the 2020 results only cover May through December. As a result the BLS isn’t including them in its historical annual time series, comparing them instead just with data from the same time period in 2019. For that and other reasons the pre-2020 trend is more meaningful than last year’s relatively sharp increase, but given that hours slept for May through December 2019 were the same as for the full year, indicating that there isn’t a big seasonal effect, I don’t think including the 2020 number as I’ve done here represents a chart crime.
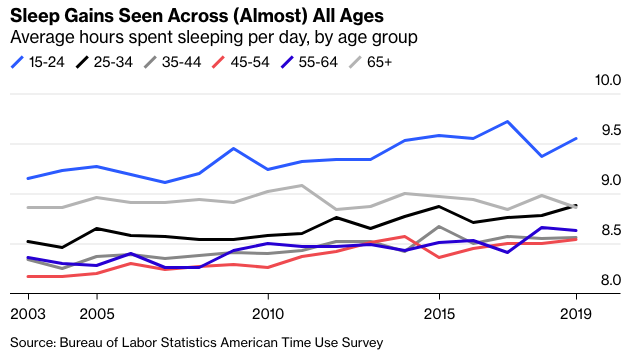
Having a y-axis that starts somewhere other than zero also isn’t a chart crime (despite what some people say), but yes the percentage changes we’re talking about here are less significant than a quick glance might lead you to think. Sleeping time went up 1.9% from 2019 to 2020, and 3.2% from 2003 to 2019. Those changes are much bigger than the standard errors estimated by the BLS, though, and the rise over the past two decades is pretty evenly distributed by age, with every group under 65 getting more sleep in 2019 than 2003.
How does one square this with the widespread view that ubiquitous smartphones and the hectic pace of modern life are resulting in an epidemic of sleep deprivation? One doesn’t, exactly. The ATUS is not the only available measure of how much sleep we’re getting, and not all the available evidence points in the same encouraging direction. The available evidence is, in fact, something of a muddle.