


According to one Census Bureau survey, 2020 was the first year on record (going back to 1947) in which the number of households in the U.S. declined. According to another Census Bureau survey, 2020 saw the second-biggest increase on record (in this case going back to 1955) in the number of U.S. households. (That’s based on the September households estimates from the vacancy survey, which I used because the October, November and December ones aren't available for as long on a continuous basis.)
This disagreement can be chalked up partly to the Covid-19 pandemic, which sent response rates to government surveys plummeting over the spring and summer, and also to the timing of the two surveys — the first was conducted in March and April, the second over the course of the year. But it turns out that estimating how many households there are in the U.S. is always hard. “For such a basic and fundamental measure, the number of households in the U.S. is largely a mystery,” three researchers from Harvard University’s Joint Center for Housing Studies lamented in 2015.
It’s a really useful number to know, though, given that household formation drives demand for housing, and by extension demand for lots of other things. In general it follows demographics, but over the past decade-plus the progression of the giant millennial generation through its 20s and 30s — usually prime years for forming households and buying first homes — hasn’t been accompanied by the expected amounts of household formation or home buying.
The consumer behavior of millennials has been the phenomenon that launched a million takes, with early arguments that they had fundamentally different priorities and values from their elders eventually giving way to an acknowledgement that no, they were mainly just broke. As three Federal Reserve Board economists put it in 2018:
We found that many of the demographic attributes associated with millennials—such as higher rates of racial diversity, higher educational attainment, and lower rates of marriage—are consistent with secular trends in the population and are therefore not the aberrations of a single generation. We showed that millennials do have lower real incomes than members of earlier generations when they were at similar ages, and millennials also appear to have accumulated fewer assets.
The distributional financial accounts that the Fed started publishing on a quarterly basis in 2019 allow us to compare the household net worth of the millennials, defined here as those born from 1981 through 1997, with that of generation X (1965-1980).
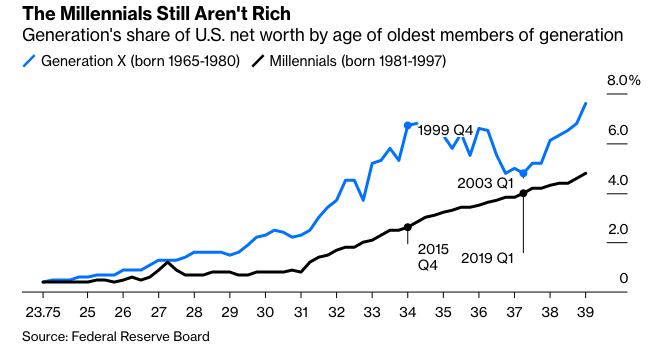
This understates the per-person gap, given that as of 2019 there were 17% more millennials than generation Xers. Still, the millennials had been catching up in recent years as the impact of Great Recession waned, and while the gap had widened again since early 2019 that was mainly because the gen Xers of circa 15 years ago were enjoying the upside of a housing bubble that would soon have its downside (which was in turn followed by a lot more upside; at the end of last year gen X controlled an estimated 27% of U.S. household wealth).
That brings us back to household formation, and estimating its growth or lack thereof. The two different Census Bureau surveys mentioned above are both offshoots of the Current Population Survey, the monthly interrogation of about U.S. 60,000 households from which the unemployment rate, labor-force participation rate and the like are derived. The Annual Social and Economic Supplement to the CPS is a more-detailed survey of about 100,000 households usually conducted mostly in March, while the Housing Vacancy Survey is based on the monthly CPS but also includes the 10,000 or so housing units selected for the CPS each month that turn out to have nobody home.
The Census Bureau’s 3.5-million-household American Community Survey also delivers annual estimates of the number of households, but it has only been in existence since 2005 and isn’t conducted in decennial census years such as 2020. Then of course there’s the census itself, which in theory surveys everybody and thus delivers what should be the most reliable household numbers, although they’ll be coming out extra late because of the pandemic and aren’t entirely compatible with the higher-frequency estimates anyway.
Here’s household formation as measured by the two annual surveys with 2020 numbers and long records, averaged out over three years because the results can be pretty volatile year-to-year, as compared with the Census Bureau’s count of housing starts, also averaged over three years.