


How is the performance of a broadly diversified portfolio properly evaluated? Against the S&P 500? That truly makes no sense. That would be analogous to comparing a tomato to salsa. Tomatoes are in salsa, but so are a lot of other ingredients. Diversified portfolios likely include a fund that is comparable to the S&P 500, but also should include a host of other asset classes—such as small-cap stocks, non-U.S. stocks, real estate, bonds, etc.
If an advisor builds an aggressive portfolio (hot salsa) for a client, what performance benchmark should be used to evaluate the performance (both volatility and return) for that specific portfolio? The S&P 500? Ninety-day T-bills? A 60/40 portfolio? Wouldn’t the most logical benchmark be a similar portfolio with a comparable asset allocation? Or, to continue the salsa metaphor, should we say the benchmark for hot salsa is another brand of hot salsa—not a mild salsa.
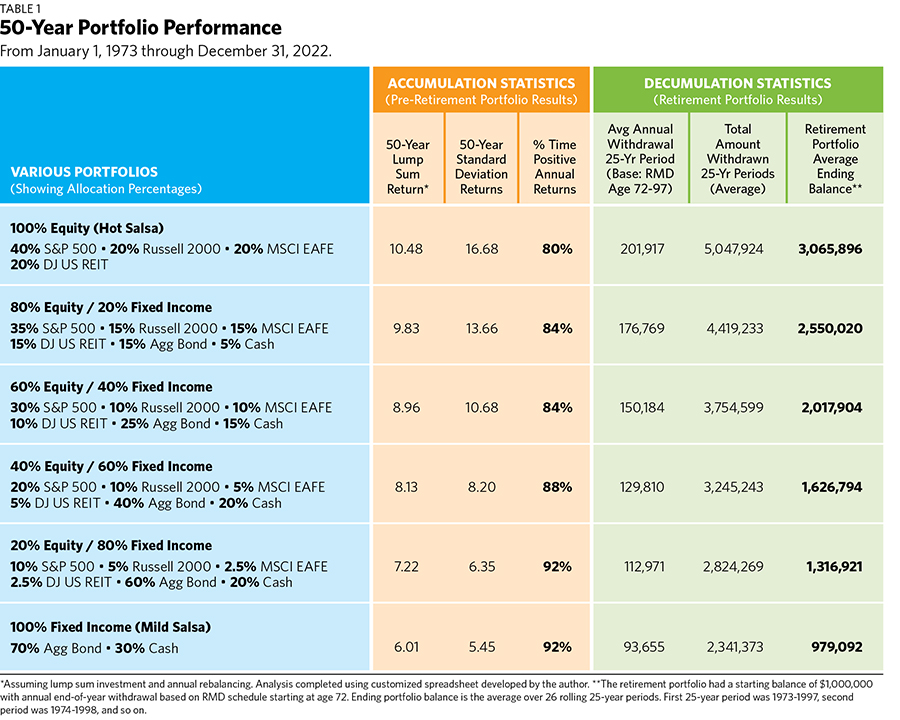
This article presents six asset allocation models (six different salsa recipes) over the past 50 years (from 1973 to 2022) that might reasonably serve as logical benchmarks for different portfolios built for clients. The six portfolio models range from 100% equity to 100% fixed income. Six well-known indexes were used to build the portfolio models: the S&P 500, the Russell 2000, the MSCI EAFE, the Dow Jones U.S. Select REIT index, the Bloomberg U.S. Aggregate Bond Index and 90-day Treasury bills. Indexes are not investable, but there is no shortage of ETFs and mutual funds that replicate them. And of course, actual investable products have expense ratios, whereas indexes do not.
One of the allocations we tested is an all-equity portfolio that has a 40% allocation to the S&P 500, while the Russell 2000, MSCI EAFE and the Dow Jones REIT each get 20%. These allocations were maintained by annual rebalancing. Taxes and inflation were not accounted for. In this model, the 50-year average annualized gross total return was 10.48% (when we assume there was a lump sum starting investment) and the standard deviation of annual returns was 16.68%.
This aggressive portfolio produced positive annual nominal (meaning not inflation-adjusted) returns 80% of the time. In other words, over this 50-year period, there were 10 calendar years with a negative return.
Real World Performance During Retirement
Now let’s consider how a retiree would have fared with this 100% equity portfolio over 25 years of retirement. Let’s assume the retiree starts with a balance of $1 million and takes annual withdrawals at the end of the year determined by the required minimum distribution rules when he or she turns 72. Using the current RMD guidelines (before the SECURE Act 2.0), the first-year withdrawal would be 3.65% of the portfolio’s ending balance. The next withdrawal would be 3.77%, the third 3.92% … and so on. When the client reaches 96, the RMD withdrawal would be 8.4%. The average required withdrawal over the first 25 years was 6.60%. Only the stipulated distribution was withdrawn—no more and no less.
We analyzed this retirement withdrawal scenario over 26 rolling 25-year periods. The first period lasted from 1973 to 1997. The second went from 1974 to 1998. The last period was 1998 to 2022. When we took all these quarter-century periods together, the average ending portfolio balance for this portfolio was $3,065,896 and the average annual RMD withdrawal was $201,917. If you want to take a starting balance of $250,000 instead, you just divide the results by four, or divide by two if you’re starting with $500,000. The total amount of money withdrawn over each 25-year period averaged just over $5 million (again, taking 25 withdrawals over 26 rolling 25-year periods).
It almost sounds like a fairy tale: that a 72-year-old retiree could start with $1 million, take out $5 million over 25 years, and finish with $3 million. Recall, this is a 100% equity portfolio, and that may be atypical for most retirees. Also consider that to achieve these results the retiree has to both annually rebalance and stay in the portfolio. They can’t bail out during rocky periods. (That is also atypical!)
The next asset allocation portfolio holds 80% equities and 20% fixed income, and is likely more representative of an actual retirement portfolio. As expected, the client’s performance metrics decline slightly during the accumulation years (in pre-retirement) and during the retirement years. The 50-year average annualized return is 9.83%, but the positive annual returns now happen 84% of the time. The average RMD annual withdrawal during retirement “drops” to just over $176,000, the total amount withdrawn over 25 years is $4.4 million on average, and the average ending balance after 25 years of withdrawals is $2.5 million. Impressive results to be sure.
The classic 60/40 portfolio produces an annualized return of about 9% and an average RMD withdrawal of just more than $150,000. The average ending balance of the portfolio doubles from $1 million to $2 million after 25 years of withdrawals. Interestingly, a 60/40 portfolio produces a lump sum return that is 14.5% lower than the all-equity portfolio but it has 36% less volatility (when you take the standard deviation of 10.68% instead of the 16.68% figure we have in the all-equity portfolio). That’s a seemingly acceptable risk/return trade-off.
We also have portfolios of 40% equities and 60% fixed income, and portfolios with 20% equities and 80% fixed income. In these, the 50-year return declines by roughly 1 percentage point (100 basis points) and negative annual returns happen only about 10% of the time.
The 100% fixed-income portfolio consists of 70% bonds and 30% cash. In our analysis, the 50-year return on this was 6.01% and the standard deviation was a paltry 5.5%. When the standard deviation of returns is lower than the average annualized return, you can assume you’re dealing with a fixed-income portfolio (though not high yield!) In this low-volatility portfolio, our hypothetical retiree had an average annual RMD withdrawal of just over $93,000, a total 25-year withdrawal of $2.3 million (on average), and an average ending portfolio balance of just under $1 million.
In all these cases, the retirement portfolio never ran out of money, since the RMD is a withdrawal mechanism based on percentages. That means you can’t kill the portfolio if there are only withdrawals based on the required minimum distribution. Other factors, of course—such as horrible investments—can indeed deplete a retirement portfolio.
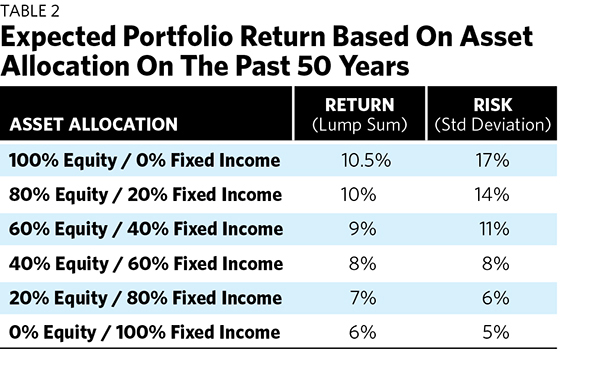
We see something interesting in the second table. I’ve done some gentle rounding, but at each asset allocation level below 100% equity the return drops by 100 basis points (or by one percentage point). In the world of broadly diversified portfolios, the range of returns stretches from roughly 10.5% for a portfolio made up entirely of equities to 6% for one made up entirely of bonds. But volatility is a different matter. The range is larger, from 17% down to 5%. In other words, asset allocation has more potential impact on volatility than on return. We often show standard deviation to our clients, but it’s seldom understood. This simple summary table suggests that 5% is a low standard deviation and 17% is a relatively high one for a portfolio.
With these simple “bookend” figures, a client can make sense out of standard deviation figures and better evaluate if the standard deviation of their own portfolio is high or low.
Craig L. Israelsen, Ph.D. teaches in the Financial Planning Program at Utah Valley University. He is the designer of the 7Twelve® Portfolio. Craig can be reached at [email protected].