


The world’s biggest bond traders see no reason to shy away from long-term Treasuries as the Federal Reserve is on the brink of its most aggressive round of rate hikes in more than a decade.
Tightening cycles have historically spurred outperformance in long-maturity debt, and managers of more than $1 trillion of fixed-income assets say this time’s no different. That confidence flies in the face of projections that the government’s debt burden will balloon by $10 trillion in the next decade, even before taking into account Trump administration plans to jumpstart the economy.
In the $13.9 trillion Treasuries market, signs abound that holders of longer-dated obligations see little risk of a substantial acceleration in growth and inflation: The term premium on 10-year notes dipped below zero last month for the first time since November; traders are paying just as much to protect against inflation over the next few years as a decade out; and there’s unprecedented demand for strips, one of the most bullish bets in the bond market.
“We don’t necessarily think this is going to be a major trend change, and that we have a longer-term break out of the downtrend in yields,” said Steve Bartolini, portfolio manager of inflation-focused strategies at T. Rowe Price Group, which oversees $188 billion of fixed-income. If benchmark 10-year Treasury yields climb to 2.75 percent or 3 percent, “those are levels we would consider adding to duration.”
Traders view a quarter-point Fed hike March 15 as a virtual certainty after Friday’s data showed U.S. employers added more jobs than forecast in February. Futures also indicate the market’s moving toward policy makers’ December projection of three rate increases in 2017. It would be the first year with multiple Fed hikes since 2006.
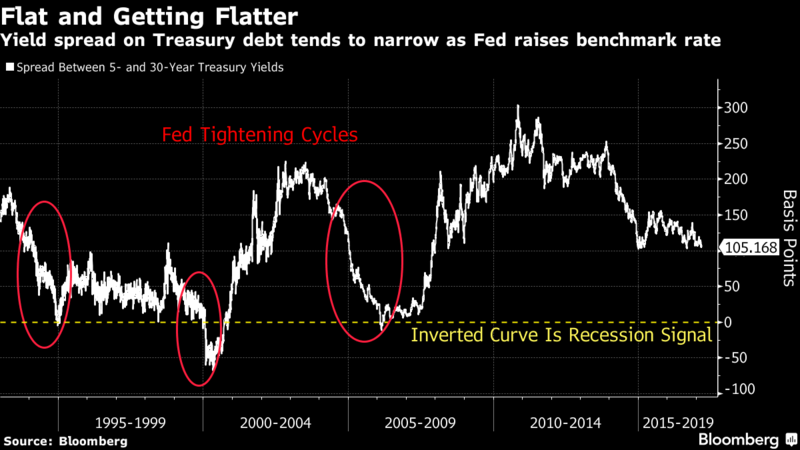
Historic Reassurance
Investors can look to the past three tightening cycles for reassurance that long-term bonds are the place to be.
At about 107 basis points Monday, the spread between five- and 30-year Treasuries was near a nine-year low, though that’s no barrier to further declines. From June 2004 to June 2006, the curve flattened to 5 basis points, from 147 the day before the first hike. From June 1999 to May 2000, it dropped to minus 52 basis points from 45. And from February 1994 to February 1995, it fell to 9 basis points from about 101.
There’s reason to suspect that history could be upended this time. For one thing, the U.S. debt load, already unprecedented, will swell 67 percent in the next decade, judging by Congressional Budget Office estimates. What’s more, Treasury Secretary Steven Mnuchin is considering issuing bonds due in 50 or 100 years, potentially reshaping the yield curve. And the recent leap in yields is spurring debate over whether the bond bull market is about to end, possibly driving up yields across maturities.
Yet indicators across the debt market show investors don’t expect longer-term yields to move much higher, let alone spiral out of control.
Term Premium
Helping depress long-term yields, the term premium -- a measure of the compensation that investors demand to hold longer maturities -- is almost non-existent.
The 10-year term premium has averaged minus 0.25 percentage point since the start of 2016, compared with positive 1.79 percentage points from 1961 through 2006, according to a New York Fed model.
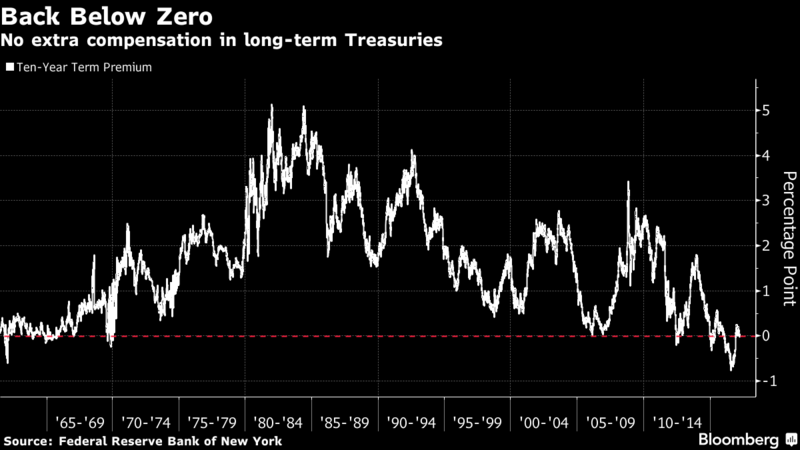
A negative term premium rarely occurred before the Fed’s bond-buying programs. The central bank still holds $2.5 trillion in Treasuries on its balance sheet as part of steps to support the economy, and the hoard may barely shrink.