


Key Takeaways
• “Sell in May and go away” has become cliché, but the data are tough to ignore.
• Market strength heading into this seasonally weak period and broad participation in the global bull market help reduce the chances of a major sell-off.
• Additionally, low odds of a recession, improving earnings, and historically strong gains after new highs further support buying any potential weakness.
“Sell in May and go away” is probably the most widely cited cliché in stock market history. May is upon us, which sparks a barrage of Wall Street commentaries, media stories, and investor questions every year about the popular stock market adage. This week, we tackle this widely cited seasonal pattern, but focus on some reasons it might not work this year.
Worst Six Months Of The Year
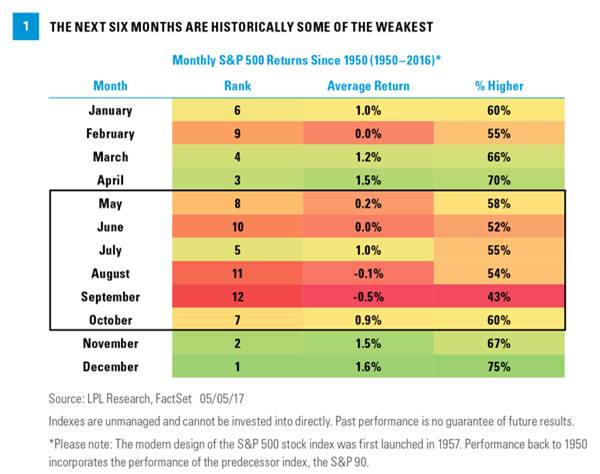
The old stock market adage “sell in May and go away” is based on the seasonal stock market pattern in which the six months from May through October are historically weak for stocks, with many believing you are better off simply avoiding the market altogether and moving to cash during the historically troublesome summer months. Stocks have gained 1.4% on average during these worst six months (since 1950*), compared with 7.0% during the November to April period.
*Please note: The modern design of the S&P 500 stock index was first launched in 1957. Performance back to 1950 incorporates the performance of predecessor index, the S&P 90.
Here are all the monthly returns for the S&P 500 Index [Figure 1]. The summer months can be rather tricky and other than a July bounce, June, July, and August have been the three weakest months of the year on average.
This brings the obvious question: If long-term history suggests these next six months are indeed the worst six-month period of the year, then why hold? While we do respect “Sell in May,” and going away for the summer months sounds like a good idea, looking at the current data in context does not actually suggest selling.
Strength Heading Into May Helps
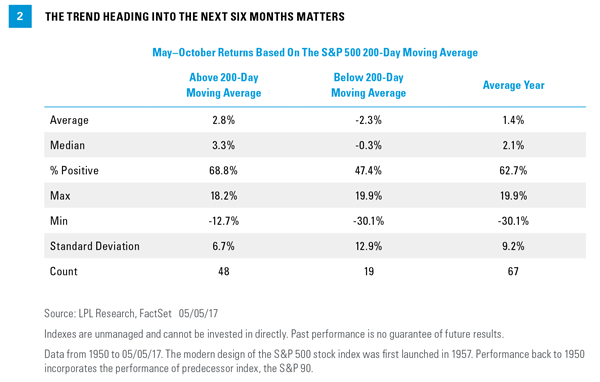
One way to assess the longer-term direction of a market trend is to use the price compared with its longer-term moving average. One popular moving average to use is the 200-day moving average, which as the name suggests is the average of the previous 200 closes. We looked back since 1950 and found that the S&P 500 was above its 200-day moving average 48 times as it headed into the worst six months of the year. Sure enough, the average gain was 2.8%, double the average of 1.4% for all years. Also, those six months were higher 68.8% of the time, versus 62.7% for all years. Further analysis showed that the 19 times the S&P 500 started under its 200-day moving average, the index fell by an average of 2.3% over the following six months and was only higher 47.4% of the time [Figure 2]. In other words, the S&P 500’s firm uptrend in 2017 may bode well for the next six months.
The Bull Market Is Global
Another reason not to “sell in May” is the strength of global markets. The S&P 500 closed at new all-time highs on Friday (May 5, 2017), but what makes the current backdrop so bullish is how strong developed and emerging markets are as well. Equity markets in Argentina, Australia, Austria, Germany, Portugal, India, Mexico, Netherlands, and South Korea are at or close to all-time highs. While not at all-time highs, markets in Hong Kong, France, Greece, Portugal, Italy, Japan, and Spain are at or near 52-week highs. The global breadth of technical strength may help lessen the potential for a big “sell in May” event.
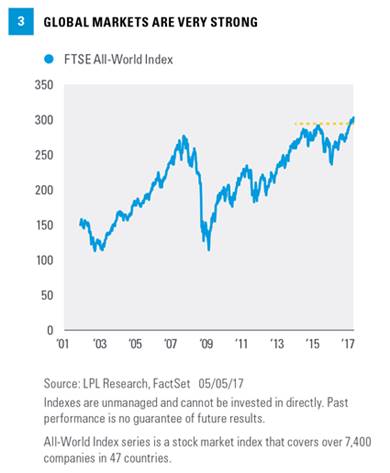
The FTSE All-World Index, which includes nearly 50 different countries and covers 98% of the world’s investable market capitalization, is an easy way to show how global markets are doing. It broke out to new highs earlier this year and made another new all-time high last week. All in all, it further confirms this bull market is global, not just a U.S. event [Figure 3].
Business Cycle And Earnigns Are Strong