Since the favorable June CPI data reported in mid-July, the yield on the 10-year Treasury has climbed approximately 50 basis points, to 4.30%.
Several reasons account for this jump, including Fitch’s U.S. credit downgrade, an easing of global demand for U.S. Treasuries, stronger than expected economic data and rising U.S. deficit spending.
Key Takeaways
• Bear Steepener—Typically, this type of move in the yield curve signifies an improvement in economic conditions. However, it could also be conveying a more ominous message to investors, given the increase in federal deficit spending.
• Real Yields—Inflation-adjusted interest rates, referred to as real yields, have been steadily increasing over the past year and can impact financing for consumers and businesses, along with valuations for risk assets.
• Equity Risk Premium—The ERP aims to capture the additional return that an investor can potentially gain by taking on the risk of holding stocks relative to Treasury bonds. The rise in market interest rates and the increase in equity valuations, presents a challenge for future equity returns.
Bear Steepener
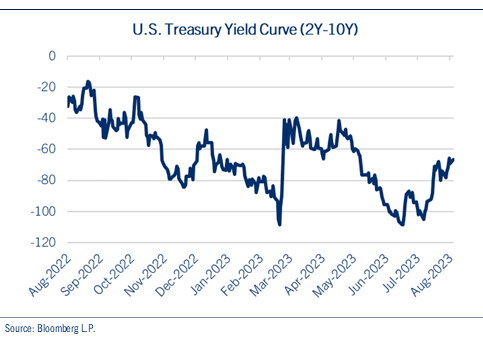
Over the past several weeks, the yield on the 10-year Treasury has climbed approximately 50 basis points, to 4.30%, a 15-year high. Though the U.S. Treasury yield curve remains inverted, with short-term rates higher than long-term rates, the gap between the two-year and 10-year Treasury yields has shrunk by nearly 40 basis points. The narrowing of this spread is the result of short rates remaining relatively anchored, while longer-term yields have climbed higher.
Typically, this type of move, known as a “bear steepener,” signifies an improvement in economic conditions. However, it could also be conveying a more ominous message to investors.
The term “bear steepener” describes two conditions in the bond market. “Bear” indicates declining bond prices, leading to higher interest rates and “steepener” refers to a situation where longer-term Treasury yields, such as the 10-year note, increase at a faster pace than shorter-term yields.
Currently, the yield on the 10-year Treasury has surged to 4.30%, marking a 15-year high, while the two-year yield has experienced a slower rise, hovering just below 5.0%. Despite the yield curve remaining inverted, the spread between the 10-year vs. two-year Treasuries has narrowed from 105 basis points to 65 basis points following the Fed’s recent interest rate hike in July. See chart: Treasury Yield Curve.

Indeed, the shape of the yield curve offers insights into market expectations.
A bear steepener usually suggests accelerating economic growth, implying that the Fed’s tightening is not excessive and there is room for further rate hikes. Historical data from Ned Davis Research reveals that over the past 35 years, equities have performed well in such interest rate environments, with the S&P 500 Index averaging a 9.5% return.
However, there are some concerns, as bear steepeners are seldom observed late in a tightening cycle. Typically, they coincide with the anticipation that an enhanced growth outlook will prompt the Fed to persist in their tightening cycle. Since the Fed appears close to the end of their rate hiking campaign, this raises the possibility that the current interest rate shift might be influenced by an excess of supply.
Indeed, there is evidence to suggest that the surge in long-term yields is driven not by growth, but by the substantial supply of Treasury bonds issued by the
U.S. government. We saw the effects when softer than expected demand during a recent 30-year Treasury bond auction, caused ripples across interest rate and equity markets. Furthermore, the Treasury Department increased the estimated amount of debt it would have to issue during the second half of the year. The combination of an increase in Treasury issuance and a shrinking Fed balance sheet may require higher interest rates to absorb the excess.
Real Yields
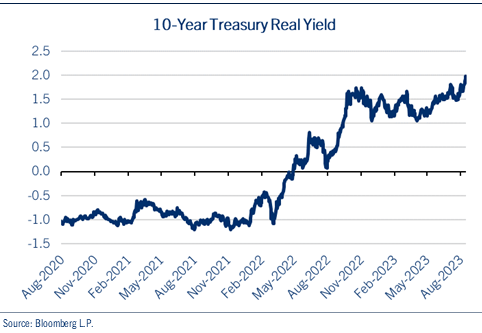
Inflation-adjusted U.S. interest rates, referred to as real yields, have been steadily increasing over the past year and recently hit their highest level since the Great Recession. So far, investors have seen the rise in real interest rates coupled with decreasing inflation as positive news. This has led to a market rally, primarily driven by major mega-cap tech and “tech-like” companies. See chart: Real Yields.

However, the rise in real rates brings forth several risks, which will put the economy’s resilience to the test. One of the most vulnerable aspects is the default rates on loans influenced by adjustable-rate financing. This has predominantly affected weaker corporate and consumer borrowers. Nevertheless, the impact is likely to expand as existing corporate debt matures and requires refinancing, especially during a period of significant tightening of bank credit lending standards.
Additionally, higher real interest rates increase the attractiveness of bonds relative to equities, offering investors the potential for an attractive risk-free return if treasuries are held to maturity.
Equity Risk Premium
The equity risk premium (ERP) measures the attractiveness of equities, in this case the S&P 500, in relation to interest rates, represented by the yield on the 10-year Treasury note. The ERP aims to capture the additional return that an investor can potentially gain by taking on the risk of holding stocks relative to Treasury bonds.
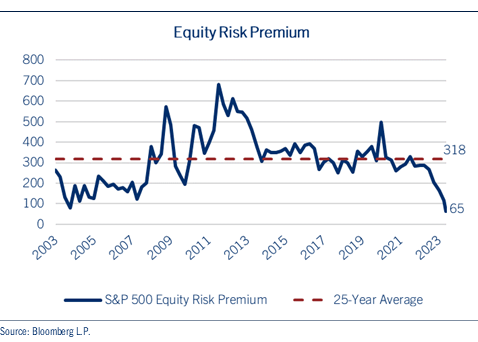
For instance, given the current S&P 500 P/E ratio of around 20X, the earnings yield for stocks calculates as one divided by 20, resulting in approximately 5.0%. When we deduct the yield of the 10-year Treasury note (approximately 4.3%), the equity risk premium comes out to roughly 65 basis points. This value is notably lower than the 20-year average of nearly 320 basis points. See chart: Equity Risk Premium.

Currently, the ERP is at its lowest level in more than two decades, posing a valuation challenge for equity markets. It is worth noting that when the ERP reading falls below its 20-year average, it can impact expected S&P 500 returns. For example, when the market’s ERP surpasses its longer-term average of 318 basis points, forward returns can approach 12.0%. Yet when the ERP is weaker than average, forward returns slip to just 6.0%.
Conclusion
The increase in market interest rates directly contrasts with market expectations that the Federal Reserve is close to the end of its tightening cycle. The bear steepener may in fact be a combination of both improving economic conditions and an oversupply of Treasury bonds, as they are not mutually exclusive.
Rising real yields pose risks to economic and market activity, with the attendant spending, investment and valuation risks for consumers, businesses and investors. Perhaps the biggest change for the financial markets, though, is the trend change in market interest rates and the impact on future equity returns. We will continue to monitor economic and market activity for signals, while providing diversified strategies for long-term portfolios.
John Lynch is chief investment officer for Comerica Wealth Management.


