A Brutal Market To Beat
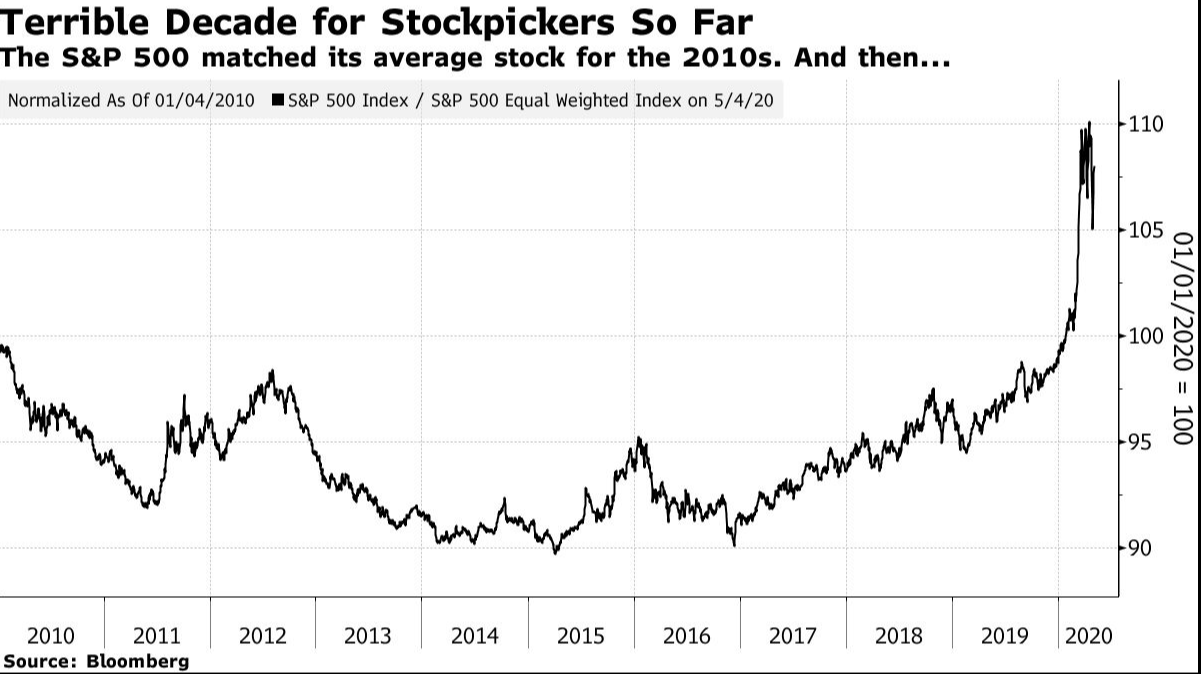
This decade is only four months old, but it’s already a terrible one for anyone trying to beat the market. The following chart shows the performance of the S&P 500 in its usual market cap-weighted form relative to the equal-weighted version, in which each constituent accounts for 0.2% of the index. When the line is sloping downward, it means the overall index is doing worse than the average stock, creating a decent chance to beat the market just by dumb luck. When it goes upward, the index is doing better than the average stock (which means in practice that big companies are dominating). The 2010s were a tough decade for stock pickers. But look what has befallen them this year:
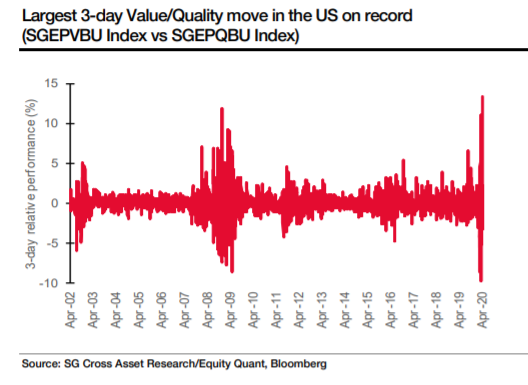
This looks extreme, because it is. In such an environment, stocks are primed for bizarre turnarounds, but timing them is close to impossible. The following chart, from Andrew Lapthorne, chief quantitative strategist at SG Cross Asset Research, shows that value stocks (which look cheap compared to their fundamentals) have just had their best three-day run compared to quality companies (with strong balance sheets) since records began nearly 20 years ago. That only happened because value had previously sold off viciously while investors piled into the stocks least likely to go bust:
The biggest culprits are, regular readers won’t be surprised to hear, the FAANGs, now increasingly also referred to as the FAMAGs (for Facebook Inc., Amazon.com Inc., Microsoft Corp., Apple Inc. and Google’s parent Alphabet Inc.). The dominance of the big Internet stocks came into play again Monday, as the S&P 500 ended the day in positive territory. The number of declining stocks almost exactly equaled the number of gainers. It was the weight of the FAMAGs that made the difference.
This is a long-running secular trend, but it has moved into a new gear in the last seven months or so. The chart below starts when the market topped in January 2018 before suffering the first of two brutal corrections. From there until last autumn, the S&P 500 failed to make any significant progress, and the NYSE Fang+ index didn’t outpace world stocks as a whole. Since then the S&P has gone on a tear, tanked, and staged a V-shaped recovery. And the Fangs have outperformed it virtually every step of the way:
To ram home just how difficult this makes life for stock pickers, we heard over the weekend from Warren Buffett, CEO of Berkshire Hathaway Inc., and by some margin the world’s most famous equity investor. Giving a virtual version of his annual investor conference from Omaha, Nebraska, he admitted that he couldn’t find appealing opportunities at present. His cash pile has grown thanks to the decision to get out of airline stocks. And while he was receiving (relatively unattractive) offers to buy or support companies at the beginning of the crisis, they soon dried up. That might have been because the Federal Reserve came to the rescue so swiftly, denying Buffett the chance to be the savior (on good terms for Berkshire Hathaway) himself.
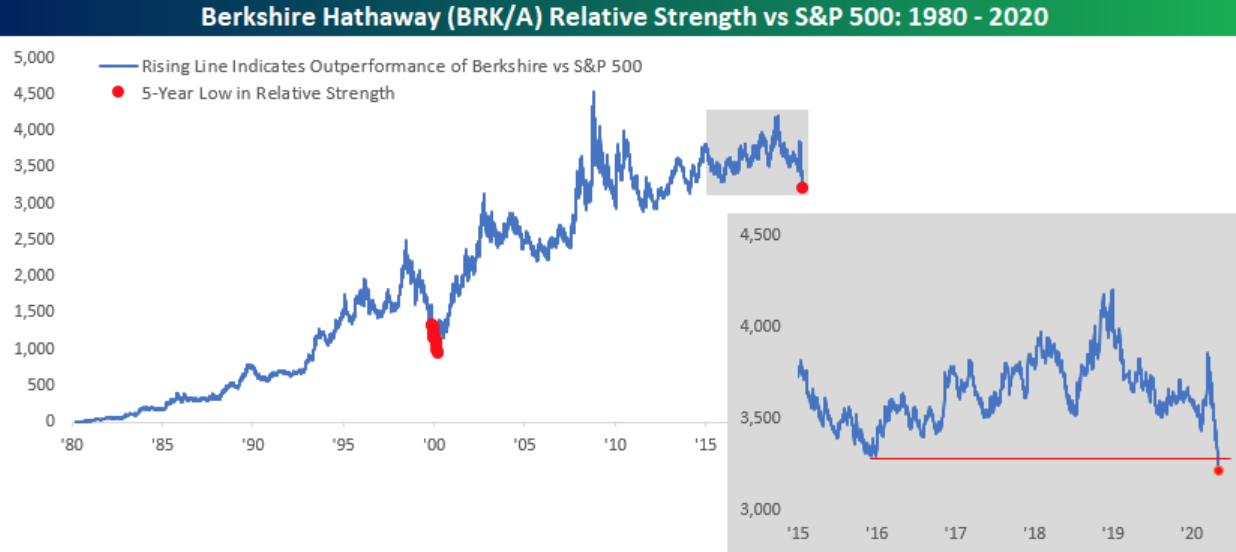
Monday’s market reaction was very negative. The idea that a crisis had hit the markets and yet the Sage of Omaha had found no way to take advantage was shocking for many. As these charts from Bespoke Investment Group show, this was Berkshire’s worst run of relative strength compared to the S&P 500 in 20 years, since the internet bubble was about to burst.