


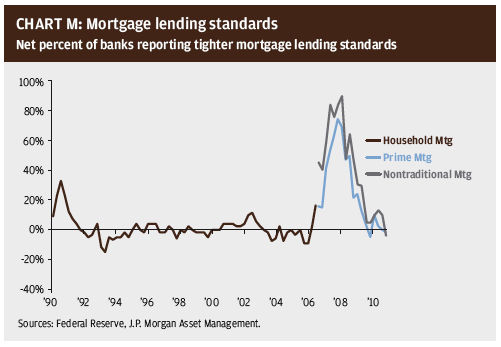
However, having said all of this, in both economics and finance, direction can be as important as levels. As shown in the chart to the right, lending tightened in the aftermath of the housing bubble, but since then banks have been gradually easing lending standards despite a very unfavorable Washington environment.
In the decision to buy a home, as in any investment decision, it is very important to distinguish between levels and changes. Home prices, housing demand and home building are very low, but they all seem set to increase. Housing inventories remain too high, but they are on a downward trend. And while the attitudes of both home buyers and home lenders remain very cautious, they should become less so in the years ahead.
The Implications Of A Housing Rebound
If the housing market does begin to recover, what could this mean for the economy? The short answer is: a lot.
First, on average, over the last 50 years, home building has accounted for 4.5% of U.S. GDP, while in the second quarter it accounted for merely 2.2%. If it took five years for housing to return to that average level, then home building alone would directly add almost 0.5% to real GDP growth each year. Moreover, on average, over the last 50 years, U.S. housing starts have
amounted to 1.491 million units per year. In every month since April 2007, starts have fallen short of this number, with a cumulative shortfall relative to this average of now 3.3 million houses. Moreover, a steady five-year climb back to this level from the current starts rate of 658,000 would result in a further cumulative shortfall of 1.2 million units relative to normal demand, potentially pushing inventory levels to well below their long-term averages.
In addition, a rebound in home prices would have a dramatic impact on household net worth. Housing is a leveraged investment. As mentioned earlier, even ignoring today's super-low mortgage rates, home prices would have to rise by roughly 27% from current levels to get back to their average relationship to average household income. If this took five years and average household income grew by 4% per year over that period of time, then home prices would rise by roughly 55% over the next five years. However, since home equity now represents just 40% of home prices, an increase of 55% would more than double the housing wealth of U.S. households.
Rising home prices should also help lending in the economy in general, as they would reduce foreclosures and the reserves that banks need to hold against potentially bad loans. Moreover, more lender confidence about the state of the housing market should lead to a more general easing of lending standards back to more normal levels.
However, perhaps most important would be the general effect on confidence of a rebound in U.S. housing. For years, the purchase of a home was a point of celebration, a first solid building block for a family's financial future. The optimism that embodies has been sadly lost in recent years, and the fretful pessimism that has replaced it has discouraged risk taking across
all dimensions. When housing recovers, it should improve the public mood, spurring more spending, more hiring and more investing. While housing has always been central to improving family fortunes, today, more than ever before, it is central to a recovery in the nation's. That is why it is important for America to realize that when it comes to housing, now is a time to buy.
Dr. David Kelly is the chief market strategist for J.P. Morgan Funds. With more than 20 years of experience, he provides valuable insight and perspective on the markets to thousands of financial advisors and their clients. He also a frequent guest on CNBC and other financial news outlets and is widely quoted in the financial press. David M. Lebovitz is a market snalyst on the J.P. Morgan Funds U.S. Market Strategy Team. In this role, Lebovitz is responsible for supporting the team's market strategists in delivering timely market and economic insight to clients across the country. Since joining the team, Lebovitz has primarily focused on enhancing the group's fixed income research efforts.
1 Unlike most consumer spending, because of the mortgage interest deduction on federal taxes, it is more appropriate to measure
housing affordability relative to pre-tax rather than disposable (after-tax) income.
2This monthly survey is used, among other things, to calculate the monthly unemployment rate.4 Using Lincoln Institute data from 1975:1 to 2011:1 and extrapolating based on construction cost and home price data through 2011:3
3 See David, Morris A and Jonathan Heathcote, 2007, "The Price and Quantity of Residential Land in the United States," Journal of Monetary Economics,
Vol. 54 (8), p. 2595-2620. Data located at Land and Property Values in the U.S., Lincoln Institute of Land Policy http://www.lincolninst.edu/resources/
4 Using Lincoln Institute data from 1975:1 to 2011:1 and extrapolating based on construction cost and home price data through 2011:3
5Based on data from the Census Bureau and the Centers for Disease Control and Prevention.
6Data are as of August 2011.
7 This calculation uses the number of mortgages outstanding according to the BLS Consumer Expenditure Survey, foreclosures as a percent of total loans,
housing inventories and assumes that 30% of foreclosed properties are listed as for sale.
8 Survey completed September 15-16, 2011 by Rasmussen Reports.
9 Survey by Pew Research Center, 10 December 6, 2006