


§ Home prices. The market will have to wait until the final two weeks of October 2016 for an update on home prices via the new and existing home sales reports for September 2016 and the S&P/CoreLogic Home Price Index for August 2016. There are various measures and sources for home price data, which are a component of housing affordability. In general, home prices rose rapidly (much faster than inflation or income growth) in the early 2000s, peaked in 2004–06, fell between 25 and 30% through 2009–10, and have been in recovery mode since then. The S&P/CoreLogic Index [Figure 5] is a good proxy for home prices nationwide. It shows the big run-up in prices in 2000–06, the big drop in prices from 2006–09, the sideways move in house prices in 2009–12, and more solid gains in 2013–16. On a year-over-year basis, the Core Logic Home Price, has been moderating over the past two years, after peaking at an unsustainable 14% year-over-year increase in late 2013, to a more sustainable 4–5% pace over the past year. We would view price increases in that range, which would be in line with recent personal income growth and consistent with the average housing price gain in the past 35 years, as a sign that the housing market is stable and poised to be a consistent contributor to GDP growth in the quarters and years ahead, without the boom bust cycle of the 1990s and 2000s.
We continue to expect that housing may add to economic growth in the years ahead. Although interest rates are likely to move higher in the coming years, we expect the increases to be modest and in general, we expect the trends that have helped the housing market recover from the housing bust to remain in place. Still, like other segments of the economy that have struggled to recover from the Great Recession, the housing recovery remains choppy and uneven.
John J. Canally Jr., CFA, is the chief economic strategist at LPL Financial.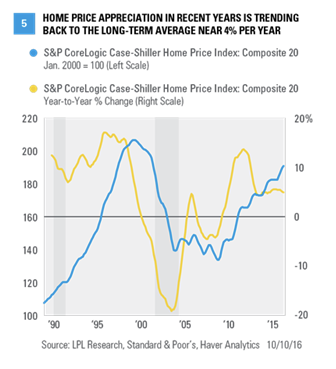
CONCLUSION