2021 kicks off the first year of a new four-year presidential cycle. One of the most popular questions we’ve received lately is how have stocks performed historically during this political year.
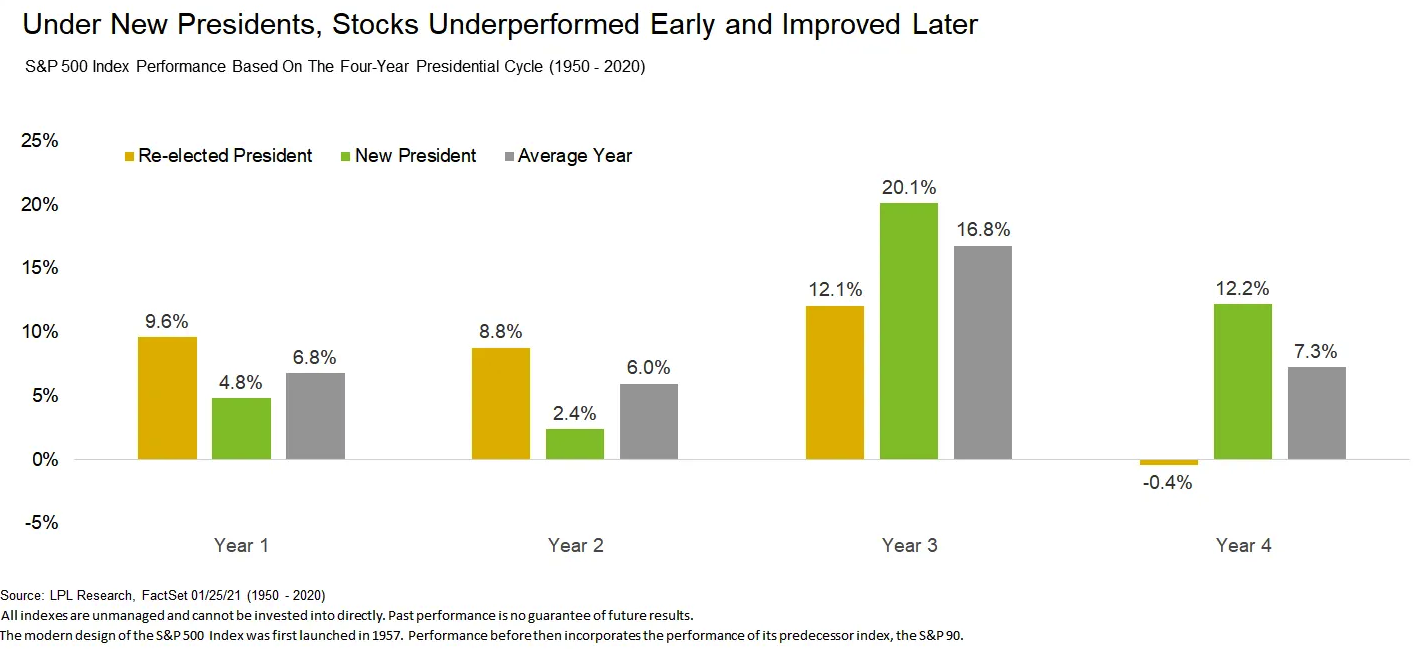
For starters, the S&P 500 Index historically has gained 6.8% per year during the first year of the four-year presidential cycle, but stocks have done better when the president was re-elected than when someone new occupied the White House. This makes sense, as a new president could bring new policies and potential uncertainty. Additionally, stocks do better during years three and four under a new president, while they are much weaker early in the cycle.
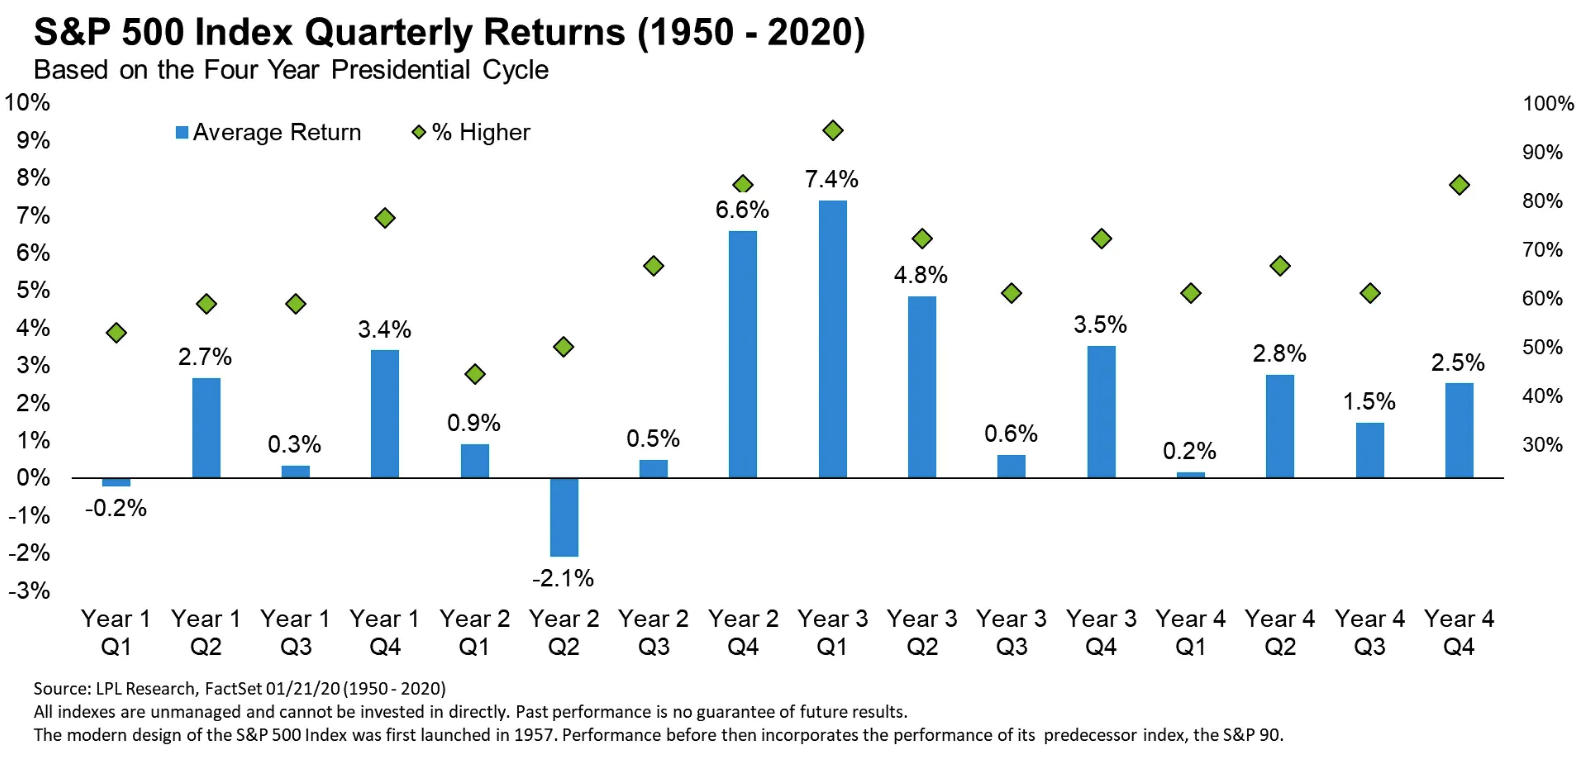
As shown in the LPL Chart of the Day, breaking down all the quarters of the four-year presidential cycle shows that the first quarter of the first year in the cycle is one of only two quarters with a negative average return.
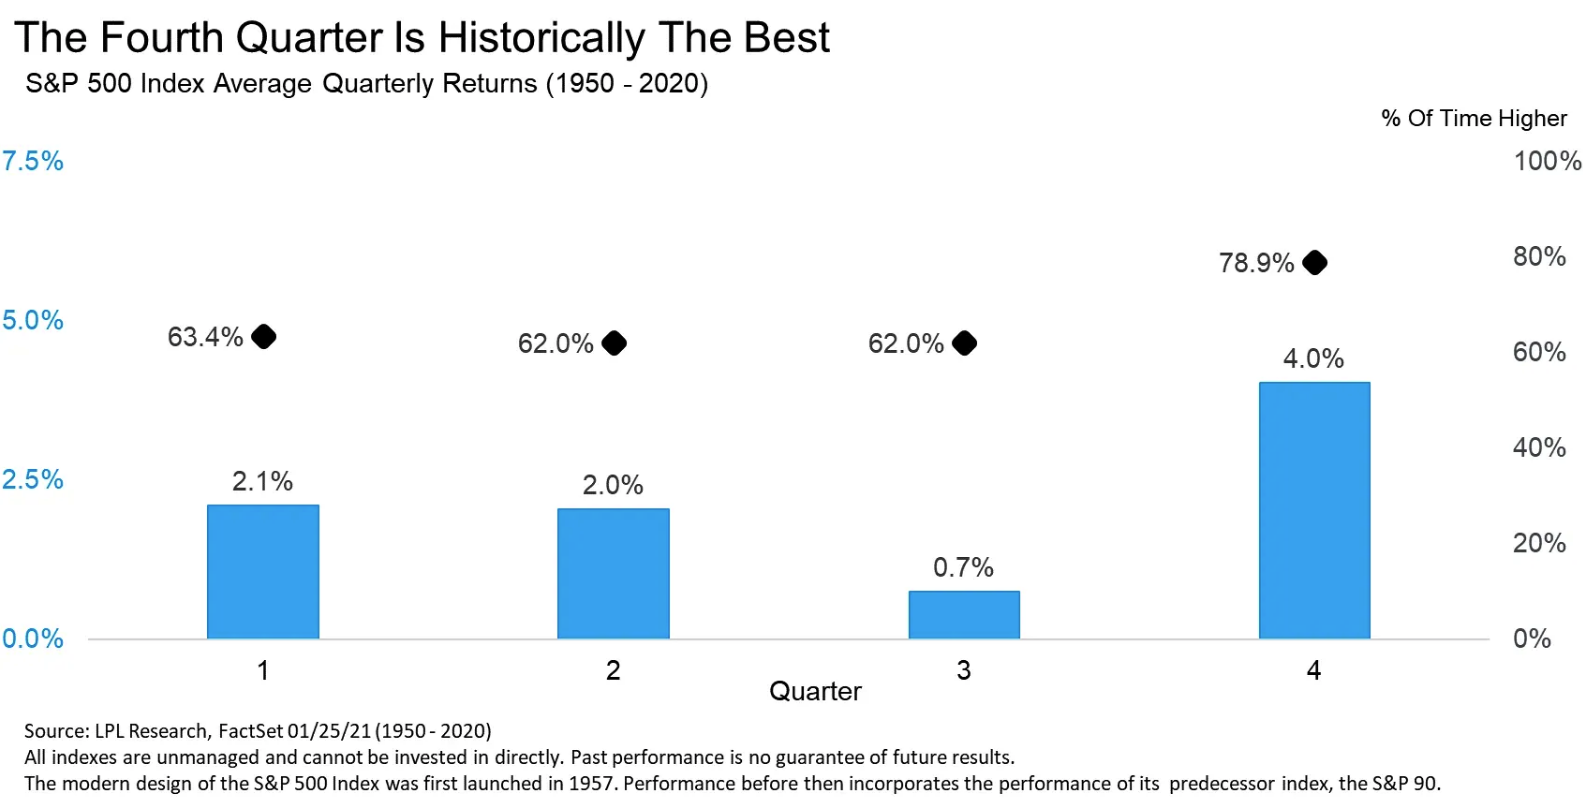
Bigger picture, historically the fourth quarter of the year has been the strongest of the year, with the first quarter the second best on average. Don’t forget, the third quarter is usually a weak one. Please note, below is for all years, not just the first year of the cycle.