


"In secular bull markets most of the surprises come on the upside!"
— Jeffrey Saut, mid-1980s
On the wall of my office hangs a record encased in a picture frame. It was given to me by a very dear friend in the mid-1980s. The tune was recorded on January 21, 1961, and was titled "Runaway," as sung by Del Shannon (Runaway). In the attendant video clip, from Dick Clark's American Bandstand, the appearance catapulted the song to the number one spot on Billboard's Hot 100, where it stayed for four weeks. You can see Del (his real name is Charles Westover) in said video. The record was sent to us because we had termed the stock market the "Del Shannon market because it was a runaway affair on the upside." That's when we coined the phrase, "In secular bull markets most of the surprises come on the upside!" Indeed, from the August 1982 closing low of 776.92, we were bullish and said so in Barron's, into the pre-Crash peak into the August 1987 closing high of 2722.42, the D-J Industrial Average was indeed a runaway with a gain of some 250 percent. Yet, the secular bull market did not stop with the 1987 Crash, despite the 22.61 percent decline in the Industrials on October 19, 1987. In fact, most of the indices actually were up on the year and the secular bull market did not end until the Dow Theory "sell signal" of September 23, 1999, despite the "forereach" (sailing term) that would carry the senior index higher into the spring of 2000. So, yesterday we wrote:
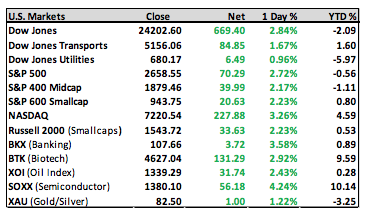
"We still favor the upside, believing the equity markets are setting themselves up for a move higher, but admittedly we have been wrong for the past five sessions. Last Friday, we got a two-step decline. The first decline ended around noon with the SPX trading around 2625 where a rally attempt began. It fizzled out at 2648, where a deeper decline commenced, carrying the SPX to ~2586 near the lows of the session, and it smacked of panic selling. And don't forget, the major market indices are market capitalization weighted indexes; and it is the large caps that are leading the way down. Meanwhile, the small/mid-caps continue to hang in there pretty well. If a move higher is in the cards it should become evident this week with a double-bottom, or "W," formation in the chart of the SPX. And this morning stocks are sharply higher on the easing of trade war fears."
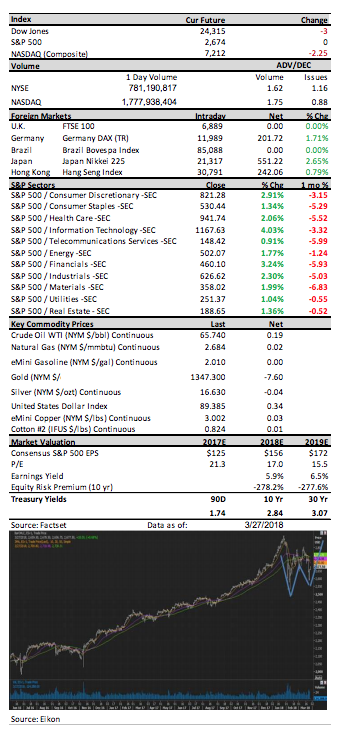
Ladies and gentlemen, a "W," or double bottoming, formation is exactly what we got yesterday in the chart of the S&P 500. Study the attendant chart and decide for yourself. This morning the preopening S&P futures are better by some 16 points as we write at 5:13 a.m. We would note, however, an ~86 point jump in the SPX between yesterday and this morning should be a difficult pace to extend in the very short term. It would be better to see some kind of backing and filling type of action for a day or two. Nevertheless, it does indeed look like a successful retest of the February lows.
Jeffrey D. Saut is chief investment strategist at Raymond James.