


With inflation now running below 3%, many are breathing a sigh of relief, perhaps thinking, “I’m glad that’s over!” But let’s not be overly hasty in popping the champagne corks. Early this year, we predicted that inflation could recede below 3%, and rebound sharply, all in the same year.
Most observers are thrilled when they correctly forecast whether stocks, bonds, inflation, or GDP is likely to go up or down. We had the chutzpah to forecast that inflation would tumble and rebound. Because last year's 6.5% inflation happened almost entirely in the first half of the year, we told our investors that there would likely be an illusion of tumbling inflation in the first half of the year, perhaps even falling below 3% by midyear, then an illusion of soaring inflation in the second half of the year. Both the benign first half and the daunting second half are illusions, because they are based entirely on the months that we are replacing from 2022.
We cautioned our investors to not join the masses in celebrating when inflation tumbled in the first half of the year. We predicted that there would be gleeful reports—whether investors, pundits, politicians, economists or reporters—that inflation is contained. That’s exactly what we’re seeing. We also cautioned our investors to recognize that a rebound in inflation during the second half of 2023 is likely, and is no basis for panic. Finally, we suggested that, if inflation rebounds in line with our expectations, we should expect countless observers to be surprised and deeply concerned. This remains a high-odds outcome.
We find it stunning that so few economists and investors look back at the months that we are replacing. Many companies invest substantial resources trying to gauge what the future months’ inflation reports will look like, and then pay little or no attention to the months that they will replace. We never know with any precision what the new monthly inflation will be, and yet we have an exact fix on the month that it will replace.
Break Out The Champagne??
Inflation is very simple, nothing more than a supply/demand imbalance. Worldwide, we paired a stimulus-induced surge in demand for goods and services (from helicopter drops of cash into consumers’ bank accounts, and a mood to spend like there’s no tomorrow!) with a lockdown-induced crash in supply of goods and services (from supply-chain disruptions, just-in-time production protocols, and millions of people either required or choosing not to work). As the causes of the supply-demand mismatch dissipate, so does the inflation.
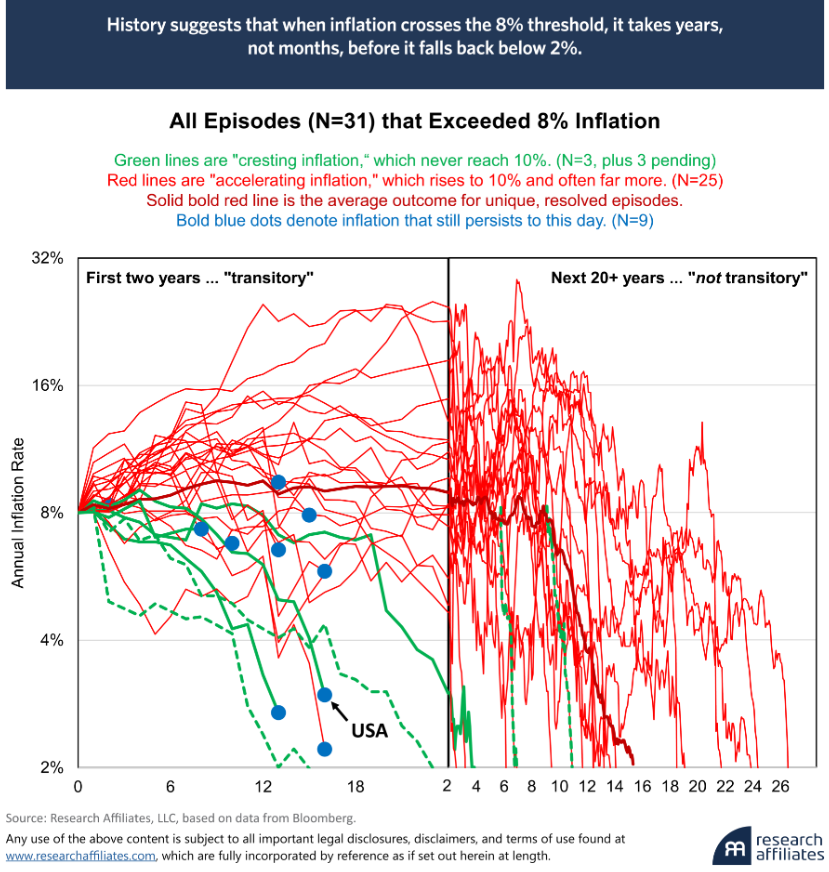
The “spaghetti graph” on the next page gives us reason to applaud the rapid slaying of the inflation demons of 2021 to 2023. Early this year, we published a paper examining the trajectory of inflation in fourteen developed economies around the world over the last half-century. We expanded on that paper in a more thorough article which appeared soon thereafter in the Journal of Portfolio Management. This graph is drawn (and updated) from that research. What does it show us?
• Inflation has crossed the 8% threshold 31 times in the 14 countries that we studied. After first exceeding 8%, it can dissipate quickly: it took only 15 months for New Zealand to see its early-1990 inflation of 8% to retreat to the 2% target that seems to be today’s central bankers’ target (ironically first proposed by the New Zealand central bank in the late 2000s). Or it can dissipate slowly: inflation crossed 8% in Spain in 1970 and did not fall below 2% until 1997, a full generation later.
• If we define “transitory inflation” based on reverting to 2% or less within two years, the current round of global inflation may produce three candidates, Canada, Spain, and the U.S. History, however, is less encouraging. If we look closer, the two past episodes of transitory inflation (New Zealand, 1990-91, and Japan, 1980-82) were nothing of the sort! These were both the tail end of multiple peaks, in which only the last surge beyond 8% inflation dissipated fast (finally). You can see the dashed green lines replicated on the right side of the graph. Here we can see that the 1980-82 inflation in Japan actually started in 1971. It only counts as a separate episode because it fell below 4% in the interim. Likewise, the New Zealand inflation of 1991-92 actually began in 1984. So, these inflationary bursts were part of a much longer-term inflation lasting 11 years and seven years, respectively.
• In nine of our 14 countries, inflation exceeded 8% in the aftermath of Covid lockdowns. In all nine of these countries, inflation is already well below its post-Covid peak. In the U.S. and Spain, it’s already below 3% and tumbling fast.
In other words, while rapid dissipation of inflation was rare in the past, this time is different. So sayeth the narrative!
Hold The Applause
Some misconstrued our inflation articles as suggesting that transitory inflation (inflation that dissipates within a year or two) won’t happen. More accurately, our work suggested that transitory inflation is entirely possible, but resides at benign end of a breathtakingly wide range of outcomes. Our counsel was that readers should not dismiss the possibility of benign or transitory inflation. Nor should they anchor on that as their central expectation.
The graph below shows the trajectory of rolling 12-month CPI inflation (seasonally unadjusted) in recent years and through calendar 2023.
• The solid dark blue line shows the actual result through year-end 2022.
• The dashed orange line shows our projection this past January, showing what would happen if every single month of 2023 were to deliver 46 basis points of monthly inflation (matching the average CPI inflation of the previous three years), with zero variability for the full year. The result is not a straight line, as the casual observer might expect. Instead, it is a pronounced "V", as a consequence of the fact that almost all of the 2022 inflation occurred in the first half of the year.
• The dashed green line shows our projection of what would happen if inflation were zero every single month of 2023. Again, we don’t get a straight line. We get an “L”. During the first half of the year, we are replacing monthly inflation of 1% with zero. During the second half of the year, we are replacing monthly inflation of near-zero with zero.
• The dashed blue line, like the solid blue line, also shows the actual inflation results, now extended through mid-year 2023. In other words, the dashed orange line, our forecast at the beginning of the year, almost exactly matched the actual outcome, the dashed blue line.
I harbor absolutely no illusions that this astonishingly tight fit is in any way normal. It was a remarkable stroke of luck that the monthly inflation reports were so steady from month-to-month, and so consistently matched the prior three-year average. The Cleveland Fed’s “Inflation Nowcast” currently projects July inflation at a manageable 35 basis points.
Because that figure will replace zero inflation from last July, this would actually take inflation higher, very nearly in line with the orange dashed line.
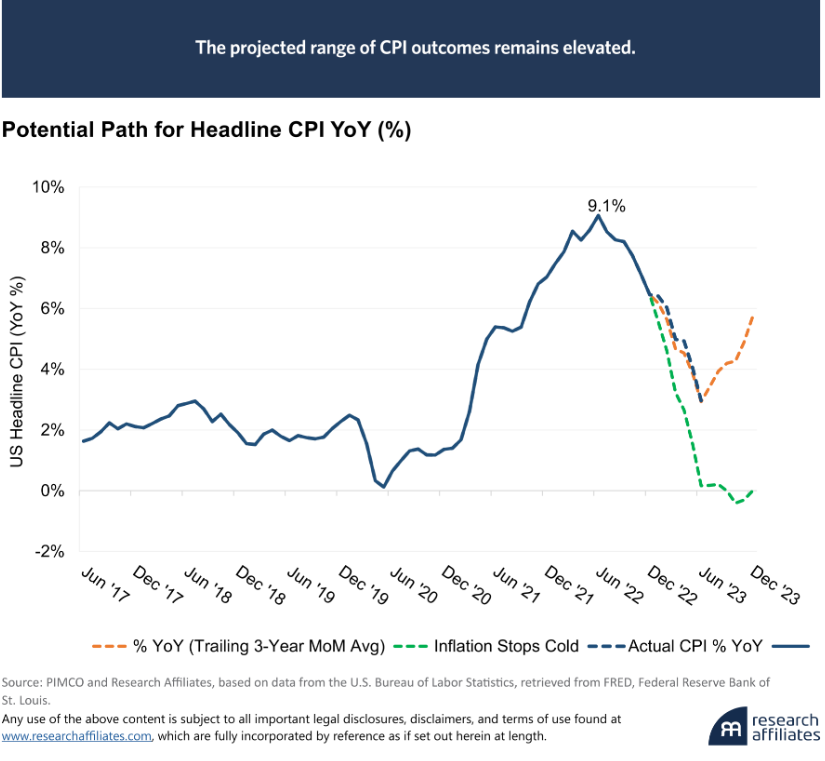
We are not as pessimistic for the second half of the year as the outlook implied by the orange dashed line. The orange line finishes the year at 5.7%, which is at the very high end of our own expected year-end range. Suppose, for example, that we see an average of 20-40 basis points of inflation each month through year-end. Then we should see the year-over-year inflation rise to somewhere between 4% and 5½% by year-end. That’s enough to be alarming to most observers, who are typically not paying attention to the low rates of inflation that we are replacing late 2022.
We find it a bit amusing that, if inflation finishes the year at half its peak levels of mid-2022, this will be an adverse shock to many (indeed, likely most) investors. If we finish the year at 4.5% inflation, we will be pleased by this usually benign denouement following a dangerous inflationary surge, but most of the investment community, media, and political elite will likely be alarmed (fear sells!).
What Does The Future Have In Store?
The first graph in this paper shows that 8% inflation is rarely benign or transitory. It takes serious policy errors—in the case of 2021-23 inflation, bipartisan errors—to trigger inflation of this magnitude. Those policy errors are unlikely to be reversed until our central bankers and political leaders have lost much credibility, and the populace no longer accepts the “bad luck” that the policy elite typically wants to blame.
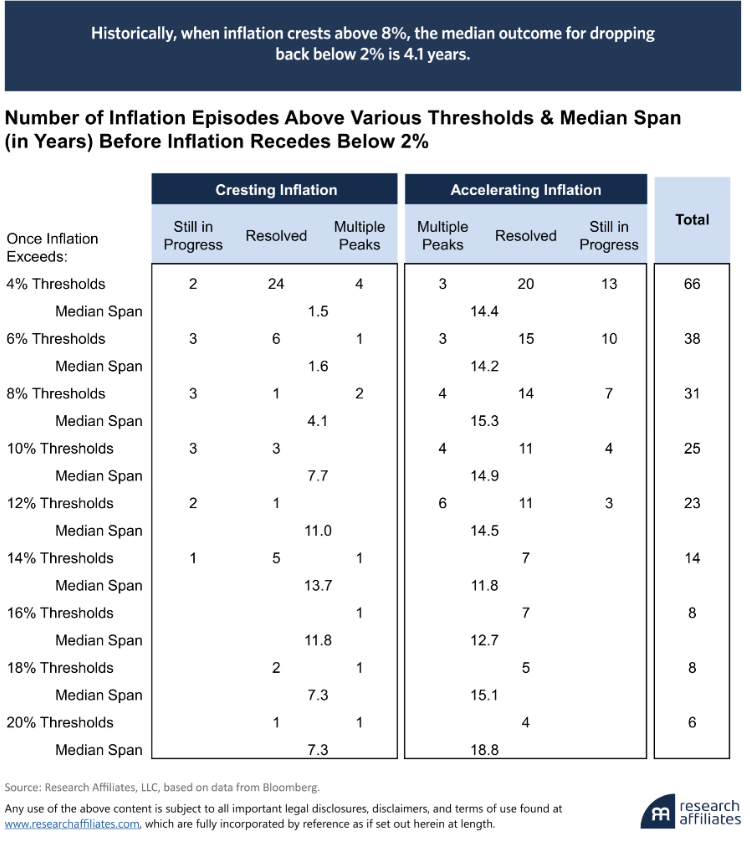
The table on the next page tells the story. If we choose to view the 8% threshold as our key measure for serious inflation, we can see that there are 21 “resolved” episodes, meaning that the inflation receded below the ubiquitous 2% inflation target. Of these, three episodes were “cresting,” meaning that they never hit 10% inflation. Three more cresting episodes are still happening now and remain elevated; the U.S. is one of these. There are three more “resolved” examples, in which inflation eventually returned to 2% or lower. Two of these involved “multiple peaks,” meaning they receded below 4% and rebounded above 8% before they finally settled down below 2%.
More typically, 8% inflation moves to higher levels, which we call “accelerating inflation.” Of the 21 resolved episodes of 8% or higher inflation, 18 went on to higher levels of 10% or more, four with multiple peaks (receding below 4% before rebounding above 8%). In the current inflationary surge, six of our fourteen countries went on to inflation levels above 10%, and have yet to settle down.
The more interesting information on this table is the median time span for getting inflation under control. When we cross 8% inflation, the median time to bring inflation to heel depends upon circumstances. If inflation crests, and does not proceed to 10% or more, the median outcome is that inflation remains elevated for 4.1 years before it is brought below 2%. If, on the other hand, inflation accelerates to the next level (10%) or higher, the median span required to contain inflation is 15.3 years.
It’s very important to note that these are historical patterns. They are not a forecast. But they are a cautionary tale. If inflation is reined in, within four years or less, investors may be disappointed by the wait. But we would count that as a success, at the benign end of our very wide range.
Conclusion
We do not reject the possibility that inflation may be benign in the not-too-distant future, with a rapid return to “normal” 2% inflation. As we’ve said repeatedly, this happy outcome is entirely possible. But it’s also possible that we’ll see a rebound in inflation. We strongly caution against viewing this benign outcome as our central expectation. Through year-end 2023, we would suggest that a rebound to 4% or more is more likely than a continuing near-term drop to 2% or less. We strongly doubt that inflation will recede below 2% in the coming year. Beyond that, anything could happen.
Our outlook is optimistic, when measured relative to historical norms, but we readily acknowledge that it’s a pessimistic outlook relative to the current rosy consensus. We posit that too many observers have not studied the past, and that they and their outlook are ill-informed.
Regardless, this too shall pass. We just think it’ll take longer than the consensus expectations.
Rob Arnott is the founder and chairman of the board of Research Affiliates. Omid Shakernia, PhD, is partner and head of research at Research Affiliates.