


We make every effort to understand the way that investors go to extremes over what we call the “well-known fact” in the stock market. A well-known fact is a body of economic information that is known to virtually everyone in the marketplace and has been acted on by anyone with capital. Over the last few months several analysts’ reports and news articles touched on just how much the glam tech stocks have added to the S&P 500. Always the contrarians, we take these moments to look around at what’s happening now and to the past for guidance on how to proceed.
The stock market in China and the Chinese economy have been a source of consternation to emerging market investors in 2018. The Shanghai-Shenzhen CSI 300 Index is the world’s worst performing major global equity market so far this year with a return of -14.83 percent as of July 26, 2018.
Our long-time readers will remember that we focused on this possibility back in 2011-2014, when the Chinese economic miracle was causing massive bull markets in oil, gold and heavy industrial companies. We can tell you that while we positioned ourselves to avoid the popularity of the mistaken mania for plays in China, it wasn’t enjoyable to be on the sidelines when all the capital in the world was chasing those new middle-class citizens.
Which brings us to today when we are many years into an era where worldwide investors are chasing the endless possibilities found in the most successful Internet-based technology companies. Simultaneously, the media, economic forecasters, market strategists and investors are being lured into fearing the durability of the current economic recovery. These market participants are very nervous about the emergence of the millennial group (23-41 years old) as a driver of GDP growth in the United States. Rather than focusing on the all-encompassing nature of the current tech-oriented financial euphoria, let’s review our thesis on the five-year outlook for the economy, homebuilding, interest rates, and how these factors might affect the best-performing stocks among companies that meet our eight criteria for common stock ownership.
We believe most portfolio managers are concerned about the current positive economic trend due to its age. This recovery is one of the longest on record, but we should remember that it was the most anemic recovery, following a deep recession, in modern history. We would argue that this recovery really started two years ago when homebuilding began to positively impact economic growth. Normally, housing drives the early stages of an economic recovery due to lower interest rates. Currently, new home inventory is running 25-35 percent below historical norms, based on available inventory versus outstanding households (Zelman and Associates).
The comeback that homebuilding is making is happening against the following background. First, the Federal Reserve Board is attempting to normalize the historically low interest rates dictated by the anemic economic recovery of 2009-2016. This has flattened the yield curve and stirred recession fears.
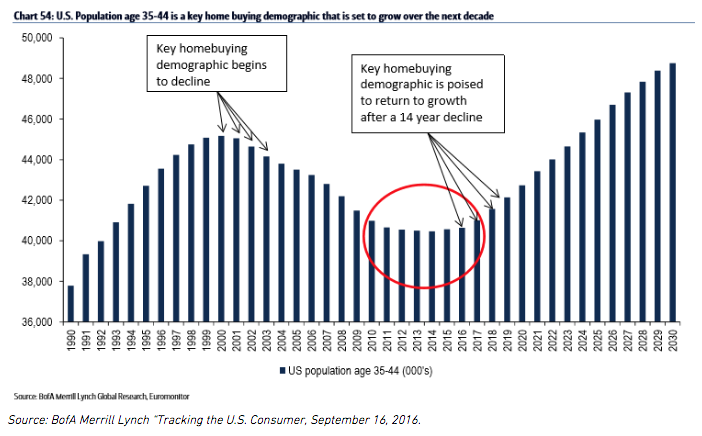
Second, the largest population group is having children at later average ages than prior generations but is establishing itself as the most important marginal buyer of homes. A recent study shows that Americans 35-39 years old had 2.18 children per household in 1990 and that the number of children has accelerated in recent years to 2.32 per household in 2016 (Zelman and Associates). The combination of a huge secular increase in the number of 30 to 39-year-old Americans and an uptick in babies per household should create massive demand in the U.S. economy over the next five years.
Third, wages are improving for the average household and confidence has been going up with those higher incomes. In other words, this massive demographic demand increase coincides with the approach of peak lifetime incomes. We at Smead Capital Management think that this demand will drive higher interest rates at the long end of the curve and most investors will be astounded to find out something that U.S. history proves is true.
History shows that when houses are the most affordable the demand for them is low and when the demand is high they are the least affordable. Think back to your entry level econ classes in college. High demand makes high prices and low demand makes low prices. Low demand causes affordability and high demand causes low affordability. For this reason, booming numbers of new household formations in 1978 caused huge demand for unaffordable homes and homebuilders met that demand by building 1.4 million homes that year. In 2011, homes were the most affordable in the United States in the last 60 years, interest rates were very low, and we built only 320,000 homes! Toss in moms and dads who want a nest for their 2.32 kids with a yard to play in and you can visualize an economy that stays strong off and on for many more years.