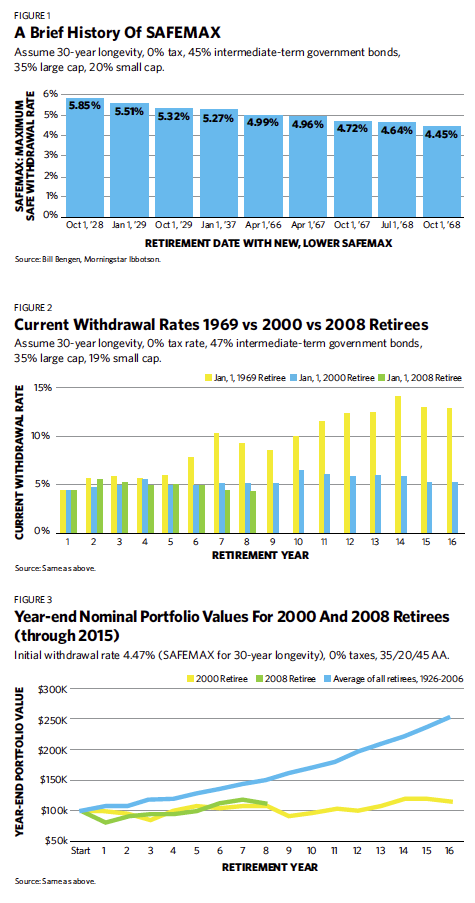
For another take on this topic, Figure 3 presents the year-end portfolio values for each year of retirement for both the 2000 and 2008 retirees. This metric is another good measure of the health of a retirement withdrawal program. As you can see, for the first eight years of retirement, both retirees had very similar experiences, with the nominal portfolio values fluctuating around the initial $100,000 level. However, both significantly trailed the experience of the average retiree during the years from 1926 to 2006. The growth of their wealth has been seriously constrained by the two large bear markets of the 21st century.
Figures 2 and 3 underscore a caveat for the 2008 retiree: If he has 22 years left in retirement, any serious problem (such as a major stock market decline, protracted high inflation or both) could change his outlook, and he might be required to make a “midcourse adjustment.” Unlike the 2000 retiree, who is more than halfway through retirement (for his expected longevity), there is still plenty of time for something to go seriously wrong for the 2008 retiree (and, concomitantly, for the 4.5% rule).
The next few years should be intriguing for students of withdrawal methodologies. History may not repeat itself; it may not even rhyme, as Mark Twain so cleverly observed. But surely, it reverberates down through time.
(Many thanks to the folks at Morningstar for providing essential updates to information contained in the Morningstar Ibbotson SBBI 2012 Classic Yearbook.)