


Just like that, the S&P 500 Index fell more than 1% on the first day of October. The rough start has many investors on edge, as October is known for spectacular crashes—specifically 1929, 1987 and 2008.
On the flipside, September 2019 was historically calm for equity markets, as the S&P 500 didn’t fall 1% on a single day the entire month.
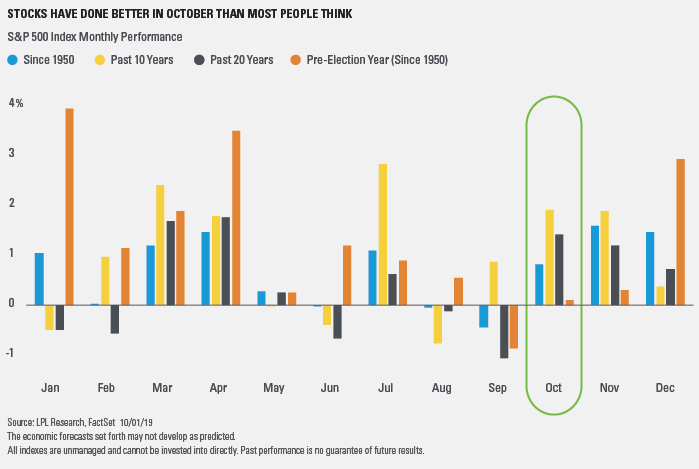
“The lack of any volatility in September could mean the usually volatile month of October could be due for some big swings,” said LPL Financial Senior Market Strategist Ryan Detrick. “The good news, though, is while October has had a bad rap for some big drops, over the past 20 years, it actually has been the third best month of the year for stocks.”
As shown in the LPL Chart of the Day, October has quietly been one of the strongest months of the year over the past 10 and 20 years. Going back to 1950, it ranks as the seventh strongest month of the year, so right near the middle of the pack.
Four other things to consider:
• Since 1950, no month has had more 1% moves (higher or lower) than October.
• Since 1928, 6 of the 10 worst single-day drops have taken place in October; however, 3 of the 10 best days ever occurred in October as well.
• This is a pre-election year, and as the chart above shows, October’s average returns in a pre-election year have been muted since 1950. The catch here is that this average return is greatly impacted by the 21.8% drop in 1987. The median return is actually quite respectable.
• October has been higher during a pre-election year every year since 1999, with an average return of an impressive 6.5%.