


On the other hand, he pays a great deal of attention to how much a company spends on intangibles such as R&D, advertising and brand development. Companies in the portfolio spend 6% of sales on research and development, about three times more than those in the index.
Vannelli says companies that spend generously on these various forms of intellectual property benefit from the “knowledge effect,” which eventually leads to better stock performance. The effect was first documented by NYU professor Baruch Lev in the 1990s when he found a correlation between what a company spends on “knowledge capital” and its subsequent stock performance.
According to Lev, the stocks of companies that invest heavily in intangibles experience less volatile earnings and stock prices than those that do not. The pattern traces its roots in accounting rules devised in the late 1970s dictating that companies must expense these investments and deduct them from current revenue. Because the value of corporate innovation is hidden from public view, at least initially, securities of companies that spend generously on innovation become undervalued. Eventually, the stock price improves once the value of these intangibles filters through to traditional metrics such as cash flow and earnings.
Vannelli says current accounting standards are stuck in a framework that favors manufacturing and industrial companies, which enjoy the more favorable tax treatment of expenses associated with the goods they produce. “Accounting rules treat all companies as if they are in the business of producing consumer goods, versus constructing their own capital stock through innovation and intellectual property.”
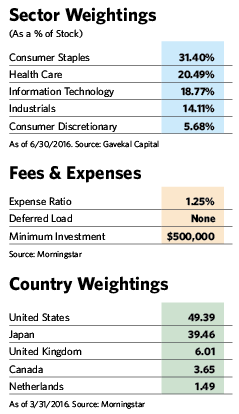
To find these knowledge leaders, Vannelli uses a series of screens that incorporate the value of intangibles for a universe of 3,000 developed market and emerging market companies around the world. The remaining group of 900 stocks skews heavily toward sectors that make the most intangible investments, such as consumer staples, health care and information technology. Sectors with little or no intangible investments, which typically include energy, financials, telecom and utilities, have little or no representation in the fund. After compiling the index, Vannelli deploys an additional set of screens to select the most promising 50 or so stocks in the fund. These equity positions cannot exceed 5% of the portfolio, although 1% or 2% is more typical, and there are no sector or geographic constraints.
The fund has its heftiest overweight sector positions relative to the index in consumer staples and health care, and together these make up about half of the equity portfolio. While these “countercyclical” sectors tend to do well relative to the rest of the market when the market is performing badly, they fare worse during bull markets. But they’ve been bucking that trend since 2008 by leading the market up. “This is the first bull market ever led by countercyclicals,” Vannelli observes.
In addition to having heavy exposure to two hot sectors, the fund has an ample stake in Japanese equities, which have outperformed most other corners of the world, including the U.S., over the past year. He believes the stocks continue to be attractively valued, and likes the companies’ high profitability and minimal debt.
Holdings from that country include food retailers FamilyMart and Lawson. Both companies have high spending on intangibles, low debt and high profit margins. Their free cash flow as a percentage of sales is 9% while it’s 1% to 2% for the average grocery chain. FamilyMart has a dividend yield of 1.8%, while Lawson’s is an even more attractive 3%.
Stocks of two Japanese pharmaceutical companies, Otsuka Holdings and Daiichi Sankyo, rose 44% and 30%, respectively, over the last year. Both companies spend substantial amounts on research and development and advertising, and have cash levels that exceed their debt.
Vannelli is much less enthusiastic about Europe, where the fund has been significantly underweight since 2010. “Europe has suffered more than other parts of the world from the retreat in globalization, and it tends to be a very cyclical market,” he says. “It’s been a political wasteland since 2008. Countries just can’t seem to agree on key issues, and Brexit is just one sign of the region’s unstable political climate.”
The fixed-income side of the Gavekal fund consists entirely of U.S. government bonds, in part because government bonds from many other developed markets have negative yields. The portion of bonds with one-to-three-year maturities nearly doubled between the first and second quarter and now makes up more than 34% of the fund’s total fixed-income allocation.
Earlier in the year, the fund had a large position in Treasury Inflation-Protected Securities (TIPS). Vannelli established the position in December 2015 when TIPS’s yields stood at around 80 basis points, but closed it out in the second quarter when prices rose and yields fell back.
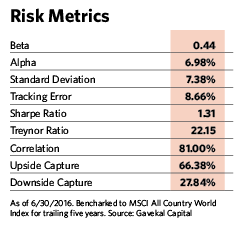
As of June 30, the fund had a mix of 71% stocks, 29% bonds and 1% cash. While the allocation toward bonds might not seem too high for an asset allocation offering, it’s a historic high for this fund, which has held as little as 10% in the asset class. Vannelli says he’s using the bonds as a ballast and protection against a possible market downturn, which he sees as a distinct possibility. “I see the risk to equity markets as a level 5 red alert right now,” he says. “All the markers for a drawdown have been back in place since the high in May 2016.”
 “As a company with a total of $750 million under management, we have the ability to establish positions in less-well-known companies such as FamilyMart and Lawson,” Vannelli says. “We don’t have the liquidity constraints that larger funds do.”
Leaving The Benchmark Behind
September 1, 2016
« Previous Article
| Next Article »
Login in order to post a comment