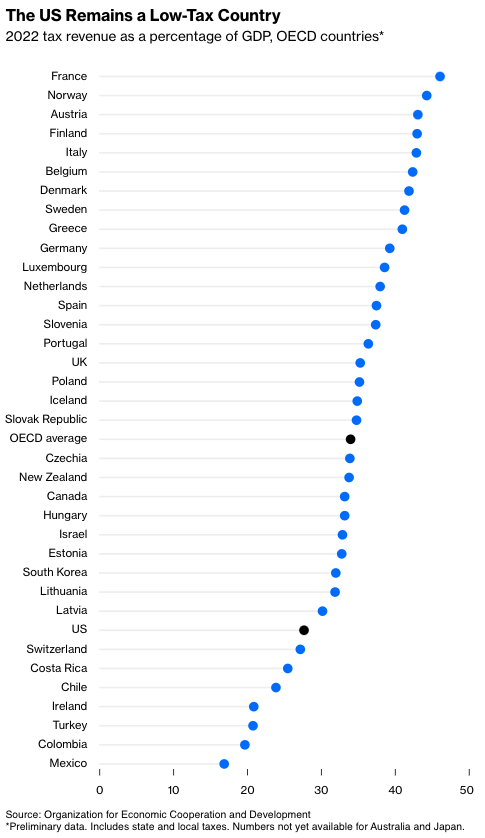
Last year was a record one for personal income taxes in the U.S. and close to a record for taxes overall. But at 27.7% of gross domestic product, U.S. tax revenue remained very much on the low side among the members of the Organization for Economic Cooperation and Development, the club of the world’s affluent democracies.
These numbers, from the OECD’s annual revenue statistics report released last week, factor in state and local taxes as well as national ones. Those state and local taxes vary depending on where you live in the U.S., with the Tax Foundation estimating 2022 state and local tax burdens ranging from 4.6% of net state product in Alaska to 15.9% in New York. This measure is not exactly equivalent to the OECD’s tax revenue as a percentage of GDP, but looking at a state’s distance from the national state and local tax burden mean of 11.2% does give some sense of where different states might fall in the OECD rankings: Alaska in the vicinity of Ireland and Turkey; New York close to South Korea.
That still puts even New York below the OECD average. By the standards of the developed world, the U.S. is a low-tax country—even in a year with especially high tax revenue—which was the result not of changes in the tax code but of an asset-price boom and high inflation that boosted incomes and pushed taxpayers into higher brackets.
When I have written about the OECD’s tax rankings in the past, I have often heard from readers who say its verdict that U.S. taxes are low is flawed because Americans face payments for health care that are covered by tax revenue in other rich countries. They have a point! Especially galling is that, despite the heavy reliance on private insurance in the US, government spending on health care is the highest in the OECD as a percentage of GDP.
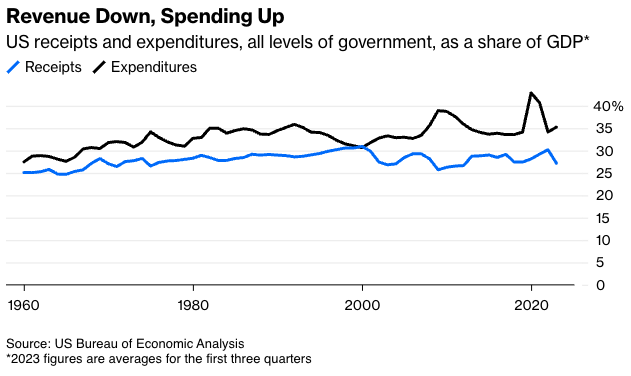
But with federal budget deficits a big issue in Washington again, the potential role of tax revenue in closing them deserves more attention than it has been receiving. In 2021, the U.S. had the OECD’s largest general government deficit as a share of GDP, at 12.1%, and while full rankings aren’t out on that for 2022, it looks as if the US deficit, while down sharply from 2021, will still be among the biggest. Since 2000, when the two were pretty much in balance, the U.S. Bureau of Economic Analysis’ estimate of government expenditures is up 4.6 percentage points as a share of GDP, while receipts (which count interest, natural resources royalties and other revenue in addition to taxes) are down 3.8 percentage points.
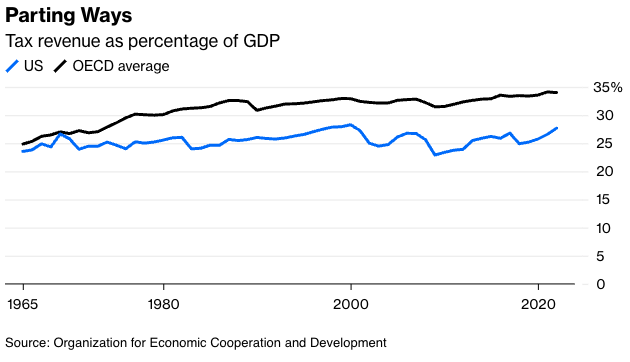
In other words, it’s not just the spending. It’s also the taxes—which are, by international standards, low. This wasn’t always the case. In the 1960s, US tax revenue was right about at the OECD average as a share of GDP. In 2022, it was 6.3 percentage points lower.
Another thing you may notice from the chart is that U.S. tax revenue is more volatile than the OECD average. That’s mainly because the U.S. depends so heavily on the volatile revenue source that is the progressive income tax. The BEA’s estimate of personal current taxes paid, a pretty good proxy for federal, state and local personal income tax revenue, rose from 10.2% of GDP in 2019 to 12.2% in 2022 and appears likely to fall back to about 10% this year without any significant changes in the federal tax code over that period. That’s because about 40% of federal income tax revenue (for some states the percentage is even higher) comes from those in the top 1% of the income distribution, whose incomes tend to rise and fall with asset prices to a greater extent than those lower on the income scale.