


Key Takeaways
• We would recommend tilting equity allocations slightly toward value because of the duration and magnitude of the growth rally, but we recognize growth may get a boost from the Fed.
• Small cap underperformance experienced over the past year may continue as the Fed’s rate-cutting campaign gets underway.
• Industrials, emerging markets, and gold may be among the beneficiaries of a more accommodative Fed, which could potentially contribute to a weaker U.S. dollar.
The Federal Reserve (Fed) is likely to start an easing cycle this week, which has several investment implications. We have written a fair amount about the Fed’s U-turn in policy stance this year, including last week’s Weekly Market Commentary. That reversal from raising rates to presumably lowering them will become a reality if the Fed cuts rates at this week's policy meeting, which concludes on Wednesday, July 31. Here we look at some potential asset allocation implications from this monetary policy transition.
Growth Vs. Value
First, let’s look at what initial Fed rate cuts might mean for growth stocks. This 10-year-old bull market has been powered by growth stocks. Much of that bull market has been accompanied by abnormally low interest rates and Fed bond purchases, also known as quantitative easing. Does that mean Fed rate cuts will fuel more gains for growth stocks?
To help answer that question we looked at a study from our friends at Ned Davis Research. The study looked at past initial Fed rate cuts to see how the relationship between growth and value stocks changed before and after those transitions. As you can see in Figure 1, in the absence of a subsequent recession within one year, growth stocks have done quite well relative to value after initial Fed rate cuts. If a recession occurred within one year of the initial rate cut (not our expectation at this time), the growth-value relationship was a pitched battle. (Note that these studies are based on Ned Davis’ classifications of growth and value stocks, which differ from the Russell indexes we normally use.)
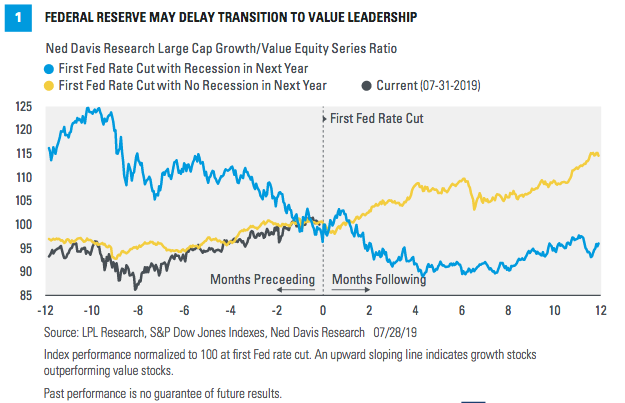
The chart also shows that in the historical non-recession scenarios, growth stocks started to outperform about nine months on average before the rate cuts. In the past year, growth stocks started a run of outperformance November 19, 2018, a little more than eight months ago. This growth outperformance may signal continued economic growth and no recession over the next year, matching our view.