


So that made a change. In absolute terms, a lot of money was lost Thursday as U.S. stocks had their biggest sell-off since June. For the most spectacular example, Apple Inc., still the world’s first and only $2 trillion company, has lost $219 billion in market cap in the two trading days since the close Tuesday. For context, that is roughly the value of Merck & Co. or Intel Corp., and is much bigger than the total current market cap of Exxon Mobil Corp., for long the world’s largest company.
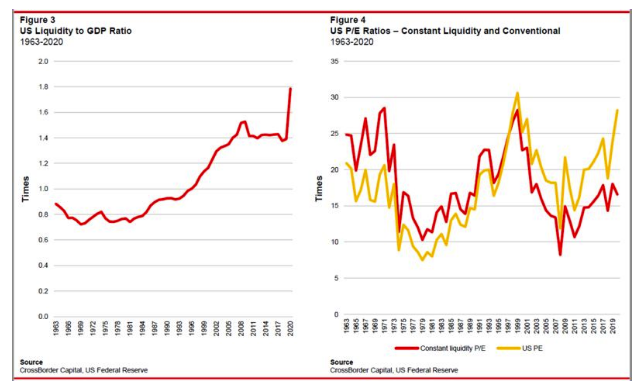
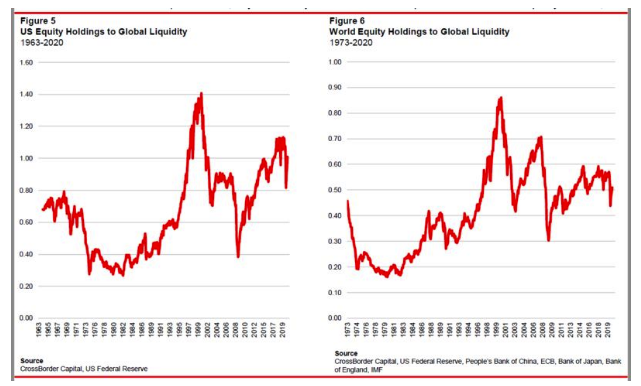
All of this is based on Howell’s dictum that there is a certain amount of liquidity in circulation, and investors have to put it somewhere (“If the money is anywhere, it has to be somewhere”). If we compare the amount of money deployed in stocks to total liquidity, for the U.S. and globally, we again find that money isn't excessively allocated to stocks:
Timing is everything when playing options markets. This is a similar chart, this time for the S&P 500 and the CBOE VIX index, which I prepared for publication yesterday, showing the same phenomenon for the broader market. Unfortunately, I chose not to use it:
What seems to have caused this is a very unusual binge on future call options, a way to bet on a sharp increase in the future. Heavy buying has been seen in all the big tech stocks currently in fashion. As more people try to bet on a future surge, those writing the options have to cover themselves against the risk of such an increase, creating a market that becomes steadily more over-extended.
This is strange, to put it mildly. How dangerous is it? Any bout of speculation brings the risk of cascading losses if bets go wrong. At present, with huge profits in the big tech names still intact, there is as yet no great reason for fear. Also, there is an intriguing disconnect with bond volatility. Generally, stocks and bonds are regarded as substitutes for each other, and so measures of their volatility tend to rise and fall together. But the Fed has put bond volatility to sleep:
This helps to enable excessive speculation in the stock market. But it also helps guard against the risk that a speculative bust in one market spreads into other asset classes.
Meanwhile, there is little clear evidence that markets are scared of a Biden victory, although managed healthcare stocks were plainly greatly alarmed late last year and again early this year by the ascendancy of progressive Senators Elizabeth Warren and Bernie Sanders. Managed healthcare stocks weakened compared to the market in the early summer, when the Black Lives Matter protests were perceived to have hurt Trump’s chances — they have stayed very stable relative to the market for a while now. As one of the most obviously politically driven sectors, this suggests that the race is still seen as open. It also points to the potential for significant volatility ahead in the inevitable twists and turns before Election Day:
It is fairly clear that the market would on balance prefer a continuation of Trump. It is equally clear that they aren't terribly scared of a President Biden. Lower tariffs would ease the pain of higher corporate taxes; he might be able to get some big infrastructure spending going; and in any case the stock markets did fine under the last two Democratic presidents. A Biden win wouldn't be very negative, and it wouldn't be a huge surprise — so it is hard to believe that the options market is guarding against that.
This was quite a moment, with no obvious trigger. It came within hours of a column from me showing that growth’s outperformance of value was even more extreme than at the top of the dotcom boom in early 2000. There are obvious similarities. Is this the beginning of another slump to match the bursting of that famous bubble?
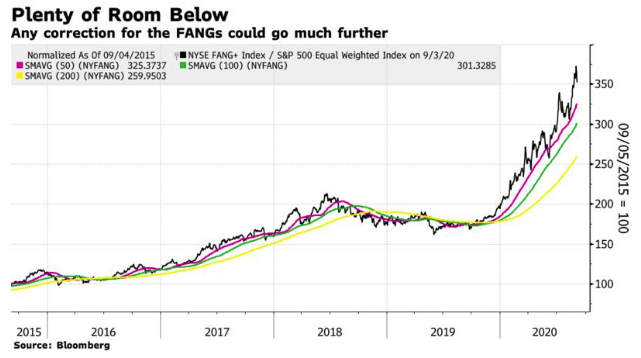
Probably not. It’s impossible to know for sure, but so far this isn't even a correction, and not unhealthy — although mammoth upheavals like this can only happen if something unhealthy is already afoot in markets. First, if we look at the NYSE Fang+ index compared to the equally weighted version of the S&P 500, we see that the outperformance of the leading technology companies still looks remarkable. There is a long way to go before this sell-off will have corrected anything.
There are two significant differences with 20 years ago. The popular stocks of today certainly include some that are very overvalued — but they are also making profits on a scale that the internet companies of 20 years ago could scarcely imagine. The following chart from Capital Economics Ltd. of London decomposes the massive outperformance of “Big Tech” compared to the rest of the S&P 500. The bulk comes from their massive profitability. If there is a bubble in the biggest tech companies, it is arguably in their profits, and how they have been allowed to build up monopolistic market power, rather than in their valuations:

Alternatively, if we compare the price-earnings multiple of the “big 5” (Apple, Microsoft Corp., Amazon.com Inc., Google holding company Alphabet Inc. and Facebook Inc.), to the P/E of the entire tech sector of 20 years ago, it doesn't appear to have come so drastically detached from the rest of the market. (Indeed, if history is a guide, the chart suggests that this episode of tech dominance can go much further.)

Then there is the issue of central banks. The tech bubble of 2000 was fueled by a huge increase in liquidity from the Federal Reserve, as it first tried to deal with the Long-Term Capital Management crisis, and then pumped out money to deal with risks surrounding the so-called Y2K computer bug. The removal of that liquidity helped to burst the bubble. However, as the following charts from Michael Howell of Crossborder Capital Ltd. in London make clear, that Fed effort was as nothing compared to what we have just witnessed. Once we adjust earnings multiples for the amount of liquidity in the system, they look unremarkable.
This isn't yet a crash, and while there are plainly some aspects of the stock market that are overblown, it isn't going to be a direct repeat of 2000.
Speculative Excess
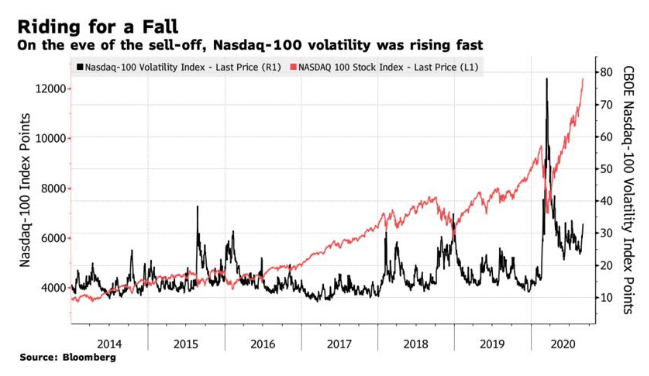
That said, some strange things are afoot. That shows up in the options market. The CBOE index of Nasdaq-100 volatility, which is based on how much investors are using options to protect themselves against future price swings, was increasing as the market rose. This is very odd; usually volatility indexes look like a mirror image of the stock market:

For a demonstration, try this chart produced by frequent correspondent Stan Jonas, who last week asked his email recipients how much they would pay for a call option to buy the S&P 500 for 4000 in December. This is very bullish, requiring a rise of about 18% over three months to pay off. But this is what happened to the price of such call options over the last nine trading days:


Volatility And Politics
One other issue begins to loom larger. The election is two months away. Prediction markets have just seen what may have been a spasm of liberal angst, as the odds in the presidential election tightened sharply. Polls in the last couple of days have generally shown that the violence in Kenosha, Wisconsin hasn't transferred into stronger polling numbers for President Trump, at least yet. It continues to be seen as a very tight affair with Joe Biden, the Democratic candidate, slightly ahead.
It is, however, beginning to exert effects on markets. Four years ago, the Mexican peso became a barometer of candidate Trump’s chances, strengthening whenever he had a setback, and selling off when he enjoyed a victory. Now, with the political agenda more on China, the yuan is playing a similar role. It isn't free floating, but it is still notable that the Chinese currency has been allowed to strengthen significantly over the last few months as Trump’s chances of re-election are seen to have weakened:


Even if markets aren't moving much on the election, they may be girding for something much more dramatic two months from now. Again, there are some very strange goings on in the options market.
The following chart was first produced by my colleague Cameron Crise earlier this week, and I have updated it. It shows movements in a butterfly between the first and third VIX contracts — or in other words, the extent to which options traders are bracing for a rise or a fall in volatility between now and two months hence. It will tend to be high when volatility is extreme, as at the height of the global financial crisis in late 2008. For it to be very low implies that options traders expect a big increase in volatility in the future. This cannot refer to any factors currently in play, because they would already have raised event risk. As Cameron shows, with the exception of one freak day during the crisis in March this year, the options market has never taken such an extreme position to guard against future event risk. Logically, this can only mean that markets are braced for the election to cause a volatility spike.

No, This Isn't A Repeat Of The Dotcom Crash. Yet
September 4, 2020
« Previous Article
| Next Article »
Login in order to post a comment