


“Nothin’ from nothin’ leaves nothin’ (Billy Preston)” . . . is the first line from Billy Preston’s hit song “Nothing From Nothing” recorded in 1974 on the album “The Kids & Me.” It was a song one of my bands used to play in an era long gone by. I recalled the tune while reading one market maven’s letter last Tuesday where the author commented that, “Monday was perhaps the nothingest of nothing days.” And, he was right because on that day the D-J Industrials limped through the session only to close down by a mere 8 points. To be sure, last week began as so many weeks have begun over the past 22 months. Recall it was in August 2014 that the S&P 500 (SPX/2099.06) first breached the 2000 level, but ever since the SPX has been trading in a relatively tight range of roughly 18%. As the good folks at LPL Research write, “[That’s] one of only five times it has traded in a range of less than 20% over a period of 22 months. Looking at the chart, 2005 and 2006 were the last times to see a range this tight. Of course, that was nearing the end of that bull market, but the two times before were the mid-1990s and late 1984. Both of those occurrences were simply a break in multiyear bull markets.”
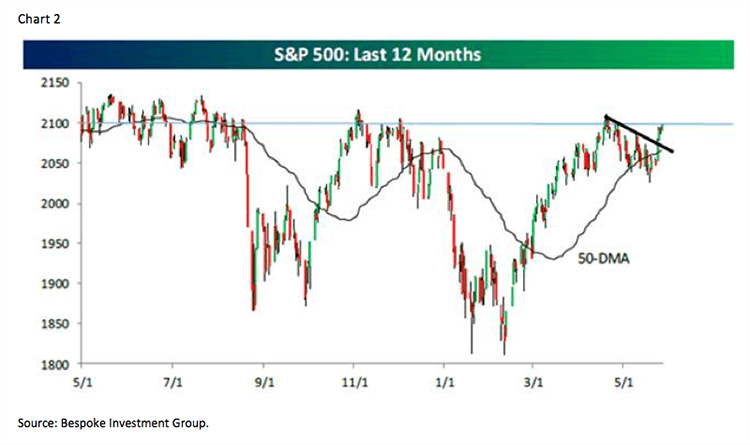
To look at the chart, and subsequent previous tight ranges, see chart 1. This range-bound stock market has frustrated both bulls and bears alike, and while Andrew Adams and I have tried to “call” the tactical moves for the SPX over the last 22 months, we have never given up on our continuation of the secular bull market “call.” As often stated in these missives, we believe what has occurred is merely an upside consolidation following a ~220% rally from the March 2009 lows into the May 2015 highs. More recently, however, it is not the 2000 level investors are focused on, but rather the 2100 level (chart 2). Indeed, the SPX has tried four times to better the 2100 – 2134 overhead resistance level, as well as the May 2015 all-time high, and has failed on every attempt. Whether this current attempt will prove successful remains to be seen, but I would note that if we do break out to new all-time highs, it would leave many investors scrambling.
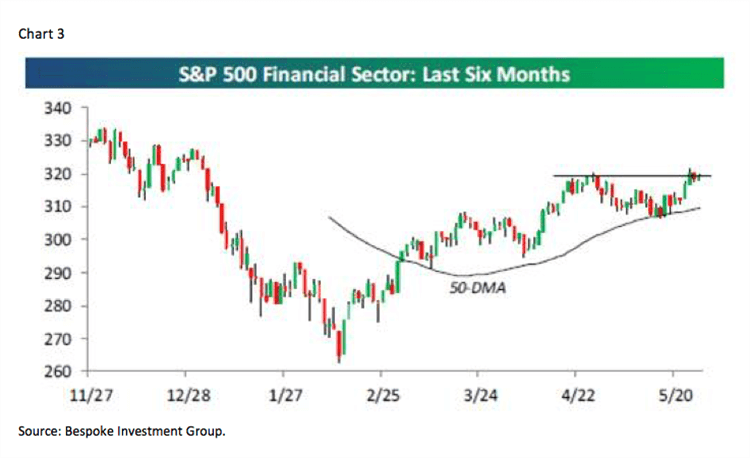
To this point, the SPX took a step in that upside direction last week as it broke out above the downtrend line that has been in existence since the mid-April 2016 high (chart 2). That breakout allowed the SPX to gain 2.28% last week, and while that was pretty good, it paled in comparison to the NASDAQ Composite (+3.44%) and the Russell 2000 (+3.43%). On a sector basis, Information Technology was the star of the week with a gain of 3.60% followed by Financials (+2.62%), which caused the S&P 500 Financial sector to experience an upside breakout in the charts (chart 3). In past comments, we have argued the only two macro sectors we can find real value in are the Energy and Financial sectors. Interestingly, there is another soon to be new sector in what will then be the S&P 11 macro sectors. The new sector will be Real Estate, with an obvious emphasis on Real Estate Investment Trusts (REITs), and the new sector will begin after the closing bell on August 31, 2016 (ET). As a sidebar, there will also be a new sub-industry for copper created at the same time.
Speaking to the REITs, my friends at arguably the premier real estate money management team of Cohen & Steers recently told me there should be more than $100 billion in demand for REIT stocks from 40 Act mutual funds just to get to a market weighting when the new sector becomes effective. While nobody has done the work on how much of the REITs will be bought by international investors, I did receive this quip from one portfolio manager that traffics in this space, “With the Bank of Japan (BoJ) now owning more than 5% in 12 different REITS and also owning more than half of the entire ETF market, the ex-Vice Finance Minister from the opposition Democratic Party basically said it’s easy to get in, but how are you going to get out. ‘As with any investment, you must always think about exit, but there’s no exit when you own half of the market.’ He is not calling for selling the BoJ positions, just to stop buying more.”
The large capitalization REITs international investors will likely be buying, which have positive ratings from our fundamental REIT research team, and that screen positively on our proprietary algorithm model, include: American Tower (AMT/$106.06/Strong Buy) yielding 1.94%; Equinix (EQIX/$366.56/Strong Buy) yielding 1.93%; and, Extra Space Storage (EXR/$92.93/Strong Buy) with a yield of 2.54%. Those names with the same metrics from our mid-capitalization research universe include: Apartment Investment & Management (AIV/$42.78/Strong Buy) yielding 3.1%; American Homes 4 Rent (AMH/$18.58/Strong Buy) yielding 1.08%; Douglas Emmett (DEI/$34.03/Outperform) yielding 2.62%; Mid America Apartments (MAA/$102.35/Outperform) with a yield of 3.25%; and, Regency Centers (REG/$77.20/Outperform) yielding 2.60%. With the “wind at their back” due to the new S&P sector status, we believe the REIT complex has higher prices in store. We think you should buy some of the favorably rated REITS by our fundamental analysts.
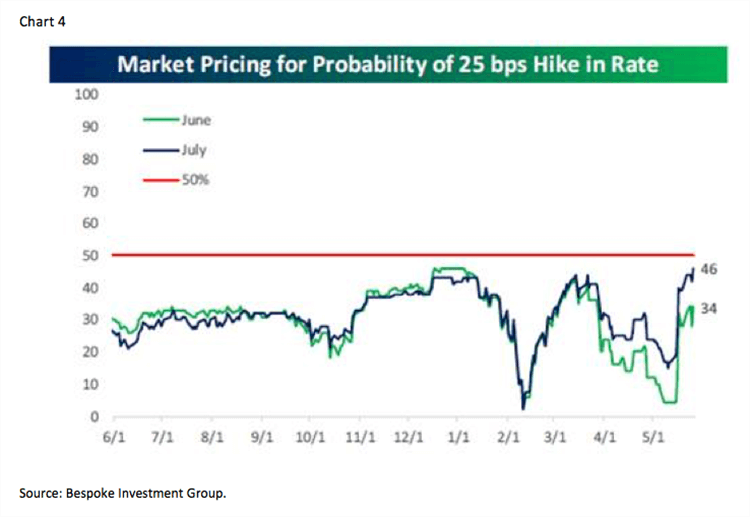
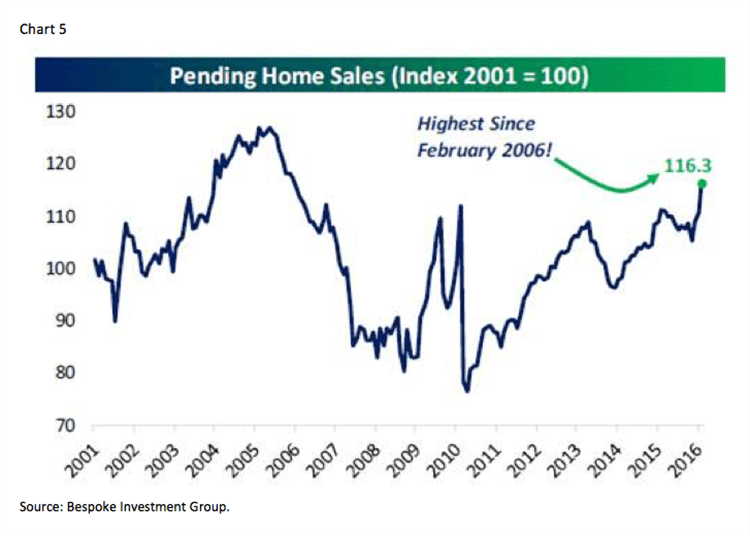
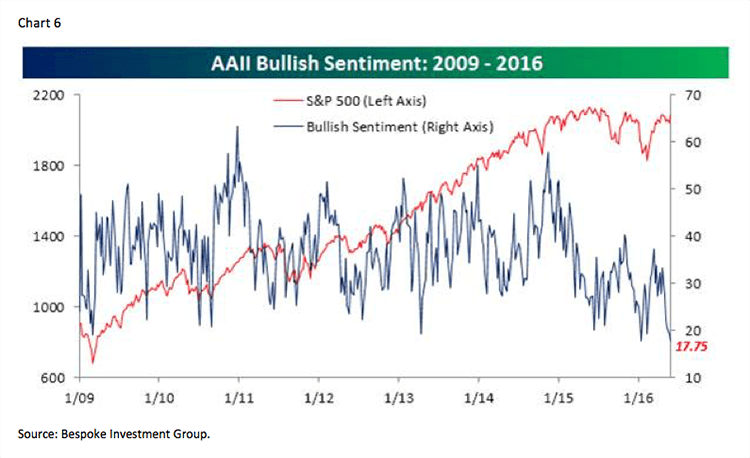
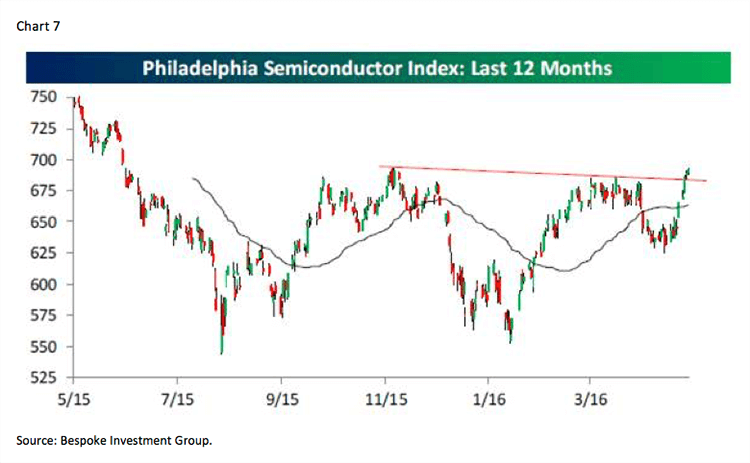
Between the “bookends” of last week: 1) most of the economic releases were weaker than expected; 2) despite that Janet Yellen kind of confirmed a rate hike in the months ahead would be appropriate (chart 4); 3) contracts to buy existing homes, new home sales, and mortgage applications all came in higher than expected (chart 5); 4) crude oil tagged $50 per barrel; 5) the AAII Bullish Sentiment figures dropped to the lowest level in a decade (chart 6); 6) the Philadelphia Semiconductor Index broke out to the upside (chart 7); and, 7) there was no post G7 “lift” for stocks. While there were many other metrics occurring last week, these were the ones that stood out to us.
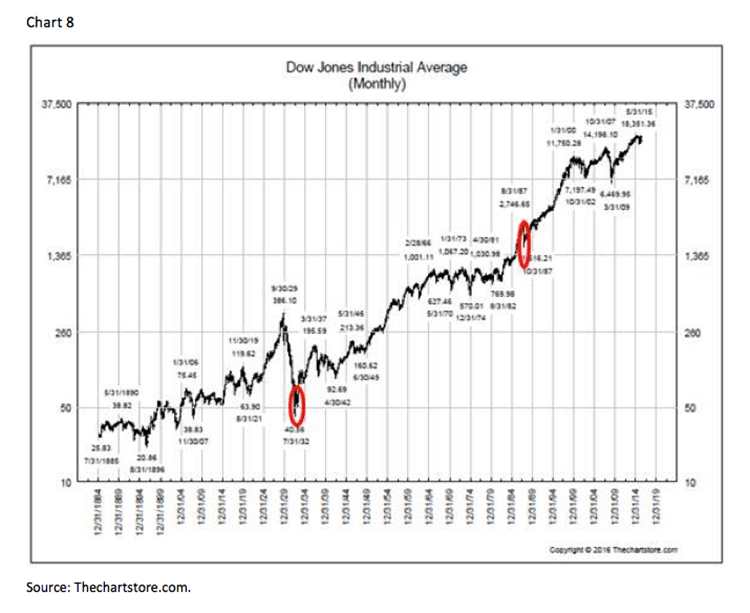
The call for this week: All of the S&P macro sectors are either neutrally configured, or overbought, on a short-term basis. Similarly, the NYSE McClellan Oscillator is overbought suggesting at least a pause to last week’s “win.” However, our internal energy indicator for the equity markets has a full charge, the lack of bullish sentiment is wildly bullish, and with headlines like this in Barron’s, “Why the Stock Market Won’t Crash – Yet,” it continues to reinforce our belief the secular bull market has years left to run. As for “crashes,” while many (like the Barron’s article) refer to the events such as: the Banker’s Panic of 1907, the Kennedy Steel Panic of 1962, the 1973 – 1974 debacle, the 2008 – 2009 Financial Crisis, etc. as “crashes,” they are not crashes! A “crash” happens over a very short period of time. By my pencil, there have only been two crashes since 1900 (chart 8). The first was the 1929 crash where the D-J Industrial Average lost approximately 25% of its value in two sessions (10-28-29 and 10-29-29). The second crash came on October 19, 1987 when the D-J Industrials lost 22.6% in a single day. Those were crashes, the various panics like the Dot-com Bubble Bust of 2000 to 2002, and the aforementioned panics, were not crashes but rather bear markets. One could make the case that the “Flash Crashes” of May 6, 2010 and August 24, 2015 qualified as “crashes” because they both occurred in one day, yet they do not qualify based on the severity (percentage) of the decline. This morning, the preopening futures are flat on no news. And, that’s how it is at session 76 in the longest “buying stampede” I have ever seen . . .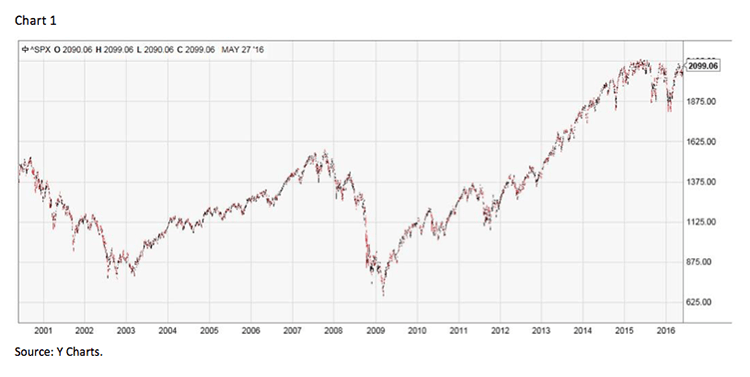
Jeffrey D. Saut is chief investment strategist at Raymond James.