


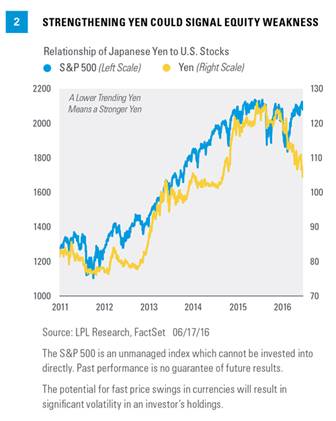
A stronger yen suggests a potentially weaker global economy, and after five years of deliberate depreciation of the Japanese yen by the central bank, the yen has begun to appreciate—and quickly. In fact, this is the highest the yen has been in nearly two years (since late August 2014). The Japanese yen is a major player in the “carry trade”—when global banks and private investors borrow money at Japan’s very low interest rates and invest in higher-yielding assets around the globe. When they determine that these investments are relatively unattractive, they tend to sell those assets and move money back to Japan, boosting the value of the yen.
As Figure 2 shows, the yen has strengthened significantly recently. Take note that on this chart, a lower trending yen actually represents appreciation of the yen relative to the U.S. dollar. When the yen has been weak, this has been generally positive for U.S. stocks—while strengthening has been mildly negative. The recent yen strength has done little to slow down U.S. equities, but history would say this is a major concern to equities should the yen continue to strengthen from here. Again, we look to yen strength as one indicator of global weakness.
Reasons Not To Worry So Much
Now the question becomes, is it really that bad? The list of worries is very well known, suggesting that if the general public is aware of the worries, the market has priced them in already. How much is priced in has no clear answer, but the reality is there are some positives out there as well. Here are a few of the key positive developments that may have the potential to produce better economic growth and stronger stock market performance the second half of the year.
#1 Strong Market Breadth
Think back to exactly a year ago at this time, the S&P 500 was up 2% year to date and struggling to gain any traction (sound familiar?). The one major negative, however, was that very few stocks were leading, which is also known as weak breadth. About the only stocks participating in the market’s gains were the so-called “FANG” stocks (Facebook, Amazon, Netflix, and Google). This weak underpinning led to massive volatility and an eventual big crack lower in August 2015, aided by China’s sudden decision to weaken its currency. Fast-forward to today and it is once again a market that is up close to 2% for the year and can’t seem to break out of a range. But this time, there is wide participation—a very good sign.
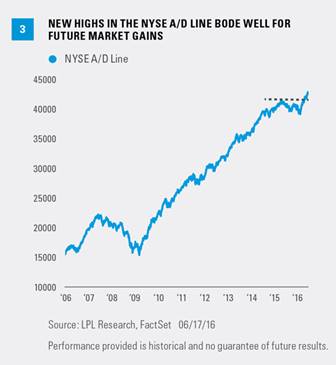
One of our favorite ways to measure market breadth is via advance/decline lines (A/D lines). A/D lines are computed daily by adding the number of securities on an index that are higher and subtracting the number that are lower. An upward trending A/D line is a sign of broad participation and underlying strength, a good sign. Turning to the New York Stock Exchange (NYSE) A/D line, it recently broke out to new highs [Figure 3]. Although the S&P 500 has yet to break out, this is one clue that there is greater participation to the current rally and the underpinnings of the market are much stronger than this time a year ago. In nearly all major market peaks, the NYSE A/D line has started to lag well before the actual S&P 500 broke down. With new highs recently hit in the NYSE A/D line, this shows very little reason to believe a new bear market will start in equities anytime soon.
#2 No One Trusts This Bull Market
Even though the S&P 500 is only 2.8% away from a new all-time high, you’d never know it by the overwhelming amount of negative investor sentiment we continue to see. For instance, the American Association of Individual Investors (AAII) Sentiment Survey has seen the number of bulls beneath the long-term average (38%) for 32 consecutive weeks dating back to the fall of 2015. This is the second-longest such streak in the history of the poll dating back to the late 1980s. Not to be outdone, the number of bears in the recent survey came in at 37.5%, the most since mid-February 2016.
We like to use investor sentiment as a potential contrarian indicator. If everyone has sold, then only buyers are left. The flip side is, if everyone is bullish, then no one is left to do any buying. Sentiment polls are one part of it, but what people say in a poll and do with their actual money is much more powerful. For instance, the CBOE Volatility Index (VIX) surged 50% in five days for only the 38th time since 1990. This shows that the demand to be hedged in case of any future rise in volatility is very high.