


“Short-term fluctuations in equity prices come too fast and furious and are caused by such a multitude of inputs that assuming they’ll directly translate into changes in real economic output is an error,” Ms. Yung wrote. Michael Antonelli, a trader at Robert W. Baird & Co., says “Big swings often just reflect human emotions. The two can disconnect in the short-term because of the immediate effect sentiment has on stocks. Then that nervousness wanes, and people capitulate, and that’s when you see the market come back.”
Indeed, “Short-term fluctuations in equity prices come too fast and furious,” and that was certainly the case last week as the D-J Industrial Average (INDU/17535.32) whipsawed its way through the week with Monday – Friday gains/losses like these: -35, +222, -217, +9.38, -185, which drove the day-trading crowd nuts. By week’s end the Doleful Dow had lost more than 200 points, and in the process broke below its May and April reaction lows. That action leaves the Industrials in negative territory for the year once again, and the S&P 500 (SPX/2046.61) darn close to doing the same. While the SPX has not violated its respective May/April reaction lows, it did break below its 10-day moving average (DMA) that we worryingly wrote about in last Friday’s Morning Tack. It also broke below its 50-DMA, which suggests it has “eyes” for its 200-DMA at 2012. Of course that would fit nicely with our model, which telegraphed a decline into last week (∓ 3 sessions), with a target of 1990 – 2000, when the SPX did not follow the S&P 500 Total Return Index to new all-time highs four weeks ago.
Within the “bookends” of the week the retail sector got slammed, leaving the retail indices down some 20% YTD. In the past this has been a modest warning signal for the overall stock market. Yet the real star for the week was the energy complex with crude oil up 3.66%, natural gas better by 5.98%, and gasoline soaring some 6.23%. Surprisingly, most energy stocks did not dance higher with the surge in energy commodities. Indeed, last week was a pretty weird week, but should have come as no great surprise given what our model has been telegraphing.
The call for this week: The stock market’s recent manic depressions have been centered on the word “recession.” I have repeatedly written that I see NO signs of an impending recession. In Barron’s over the weekend, my friend Sam Stovall (S&P Capital IQ and son of the legendary keeper of the GM indicator Bob Stovall), wrote:
“Granted the current [economic] expansion is the forth longest since 1900 and lasted more than twice the median duration of the prior 21. Yet we think this worry is premature, and put the likelihood of slipping into a recession during the remainder of President Barack Obama’s second term in office at 15% to 20%.”
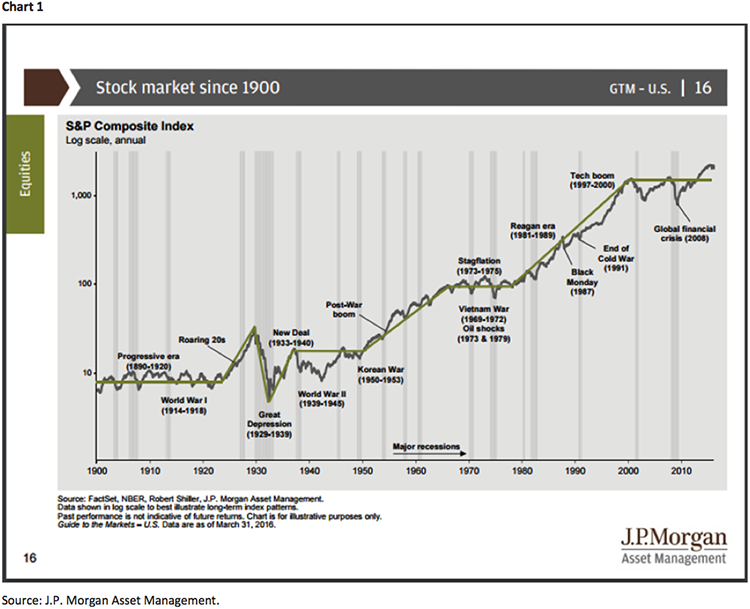
Plainly we agree! Worth noting is that in the past three years, paycheck income has increased by a 4.3% annualized rate, far better than the real GDP growth rate. Moreover, every other semi-truck I see has a sign on the back saying “drivers needed” (buy the trucking stocks recommended by our analyst); and, every other fast food restaurant my grandkids want to stop at has a sign reading “Help Wanted.” These are not the kind of things you see in front of a recession. Clearly, Andrew and I attempt to “call” the near-term wiggles in the equity markets. However, we have NEVER wavered in our belief that the secular bull market remains alive and well. Just look at the attendant chart on the next page and observe that every market peak has subsequently been surmounted with higher prices. We have no doubt that will be the case this time. Our model was looking for a meaningful “low” last week, or early this week (∓ 3 sessions), so stay nimble on a trading basis. Longer-term, this is still a secular “bull market.”
Jeffrey D. Saut is chief investment strategist at Raymond James.